11.2 Genetic Mapping
A genetic map (or recombination map) is a representation of the linear order of genes (or loci), and their relative distances determined by crossover frequency, along a chromosome. The fact that such linear maps can be constructed supports the concept of genes being arranged in a fixed, linear order along a single duplex of DNA for each chromosome. We can use recombination frequencies to produce genetic maps of all the loci along each chromosome and ultimately in the whole genome.
Calculating Map Distance
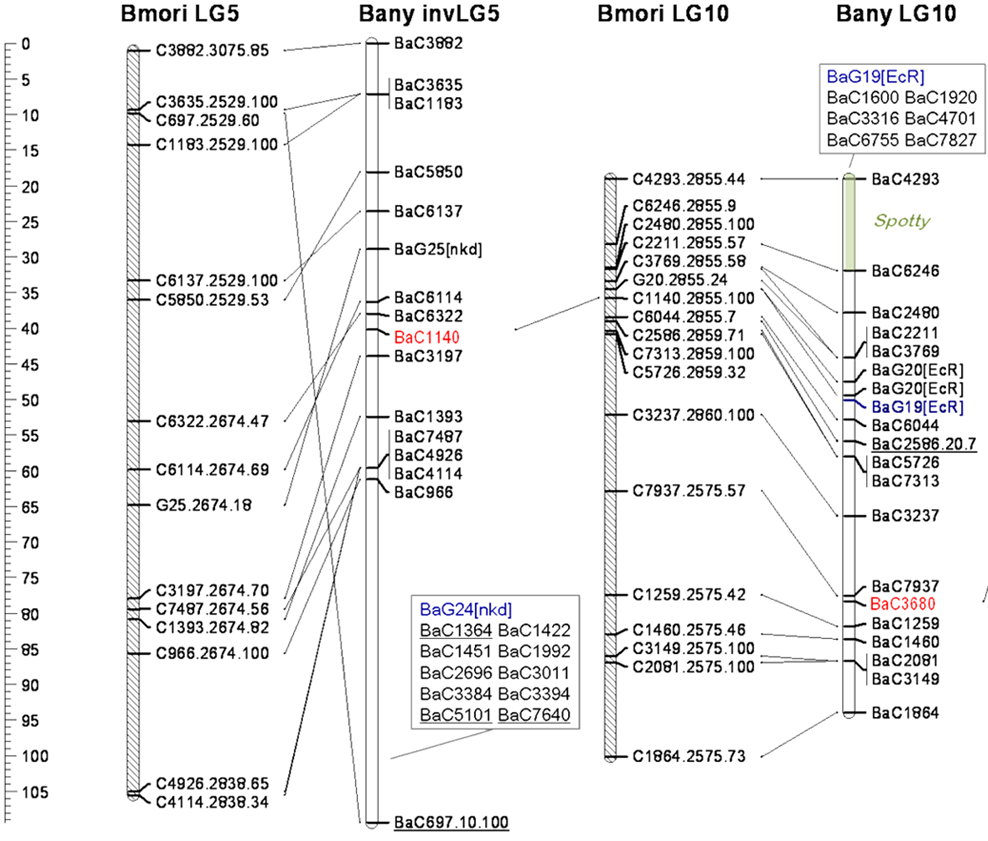
We previously discussed the concept of linkage, and we have looked at the process by which we calculate recombination frequencies. Now, we would like to combine these two concepts to construct genetic maps. A genetic map shows the relative location of two or more genetic traits. Usually, we analyze the offspring in a particular cross, and track how many times two given genetic traits are inherited together; for instance, eye color and wing shape. The higher the percentage of progeny that inherit both traits together, the closer the genes responsible for the traits are on the chromosome. So, genetic maps are based on rates of recombination (physical maps are based on physical distances, which we will look at in Chapter 12). Figure 11.2.1 shows a typical genetic map, giving the relative distances between and among various genes in the moth, Bombyx.

The units of genetic distance are called map units (mu) or centiMorgans (cM), in honor of Thomas Hunt Morgan by his undergraduate student, Alfred Sturtevant, who developed the concept of genetic maps. Geneticists routinely directly convert the recombination frequencies of two loci into cM. Thus, the recombination frequency in per cent is approximately the same as the map distance in cM. One map unit is equal to a 1% recombination rate. Gene maps that you create based on experimental data will look a lot more like Figure 11.2.2 (and less like Figure 11.2.1!).

Genetic distances measured with recombination rates are also approximately additive — so if we take the gene map shown in Figure 11.3, the distance between gene A to B is 8 m.u. and from B to C is 12 m.u. — therefore, the distance between A and C is 20 m.u. and gene B is located between genes A and C. Note, however, this approximation works well only for small distances (RF<30%) but progressively fails at longer distances. This is because as the two loci get farther apart the RF reaches a maximum at 50%, like it would for two loci assorting independently (not linked). In fact, some chromosomes are >100 cM long but such loci at the tips only have an RF of 50%. Calculating the map distance of the whole chromosome (end-to-end) of over 50 cM comes from mapping of multiple loci dispersed along the chromosome, each with a value of less than 50%, with their total adding up to the value over 50 cM (e.g., >100 cM as above). The method for mapping of these long chromosomes is described next. Note that the map distance of two loci alone does not tell us anything about the orientation of these loci relative to other features, such as centromeres or telomeres, on the chromosome.
Take a look at the video, Gene Linkage and Genetic Maps, by Professor Dave Explains (2020) on YouTube.
Map Distance Over Long Chromosomes
Map distances are always calculated for one pair of loci at a time. However, by combining the results of multiple pairwise calculations, a genetic map of many loci on a chromosome can be produced (Figure 11.2.2). A genetic map shows the map distance, in cM, that separates any two loci, and the position of these loci relative to all other mapped loci. The genetic map distance is roughly proportional to the physical distance, i.e., the amount of DNA between two loci. For example, in Arabidopsis, 1.0 cM corresponds to approximately 150,000 bp and contains approximately 50 genes. The exact number of DNA base pairs in a cM depends on the organism, and on the position in the chromosome. Some parts of chromosomes (“crossover hot spots”) have higher rates of recombination than others, while other regions have reduced crossing over and often correspond to large regions of heterochromatin. When a novel gene or locus is identified by mutation or polymorphism, crossing it with previously mapped genes, and then calculating the recombination frequency can determine its approximate position on a chromosome. If the novel gene and the previously mapped genes show complete or partial linkage with an existing locus, the recombination frequency will indicate the approximate position of the novel gene within the genetic map. This information is useful in isolating (i.e., cloning) the specific fragment of DNA that encodes the novel gene. This process called map-based cloning. Genetic maps are also useful to (1) track genes/alleles when breeding crops and animals, (2) in studying evolutionary relationships between species, and (3) in determining the causes and individual susceptibility of some human diseases.
Genetic Maps are an Approximation
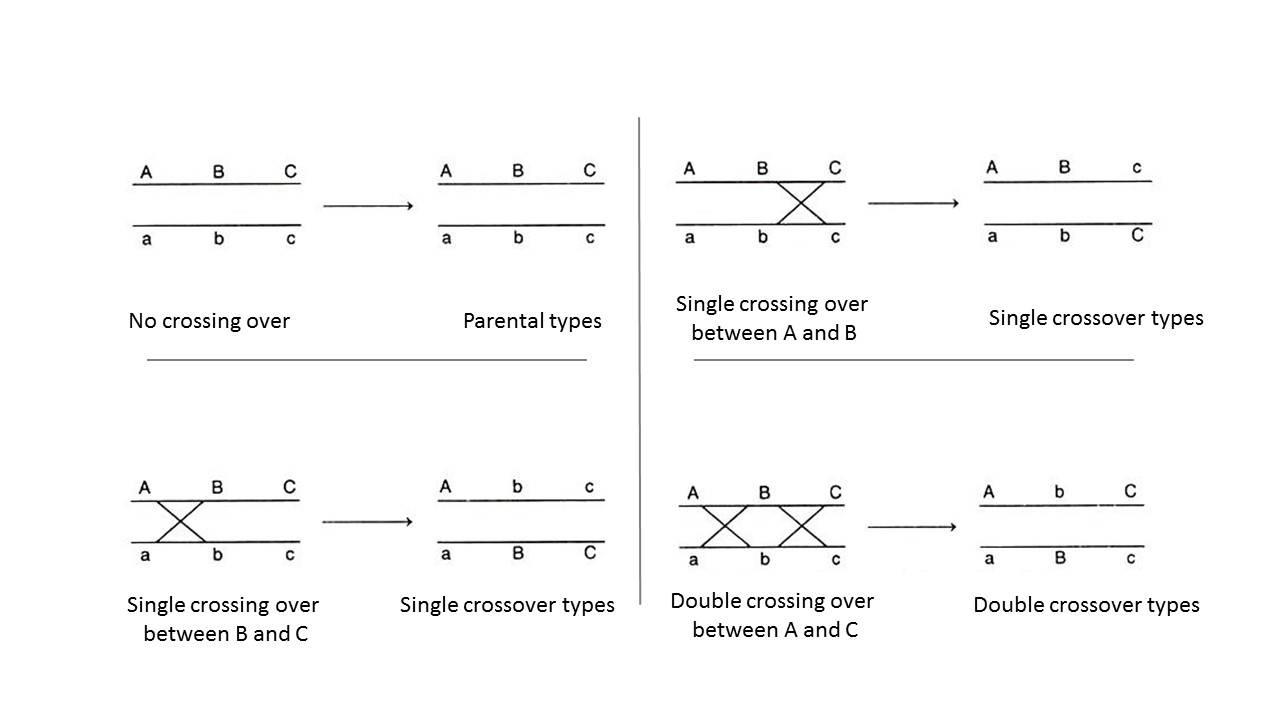
Genetic maps are useful for showing the order of loci along a chromosome, but the distances are only a relative approximation. The correlation between recombination frequency and actual chromosomal distance is more accurate for short distances (low RF values) than long distances. Observed recombination frequencies between two relatively distant markers tend to underestimate the actual number of crossovers that occurred. This is because as the distance between loci increases, so does the possibility of a second (third, or more) crossover occurring between the loci. This is a problem for geneticists, because with respect to the loci being studied, these double-crossovers produce gametes with the same genotypes as if no recombination events had occurred (Figure 11.2.3), so they have parental genotypes. Thus, a double crossover will appear to be a parental type and not be counted as a recombinant, despite having two (or more) crossovers. Geneticists may use specific mathematical formulae to adjust large recombination frequencies to account for the possibility of multiple crossovers, and thus get a better estimate of the actual distance between two loci.

Media Attributions
- Figure 11.2.1 Figure 3 attributed to NCBI-NIH (2017), public domain, Open Genetics Lectures, modified from original from Beldade et al (2009).
- Figure 11.2.2 by N. Ramroop Singh
- Figure 11.2.3 by N. Ramroop Singh
References
Beldade, P., Saenko, S. V., Pul, N., Long, A. D. (2009, February). Figure 3. A gene-based linkage map for bicyclus anynana butterflies allows for a comprehensive analysis of synteny with the lepidopteran reference genome [digital image]. PLOS Genetics 5(2): e1000366. https://doi.org/10.1371/journal.pgen.1000366.g003
NCBI-NIH (2017). Figure 3. Genetic maps for regions of two chromosomes…[digital image]. In Locke, J., Harrington, M., Canham, L. and Min Ku Kang (Eds.), Open Genetics Lectures, Fall 2017 (Chapter 19, p. 2). Dataverse/ BCcampus. http://solr.bccampus.ca:8001/bcc/file/7a7b00f9-fb56-4c49-81a9-cfa3ad80e6d8/1/OpenGeneticsLectures_Fall2017.pdf
Professor Dave Explains. (2020, March 18). Gene linkage and genetic maps (video file). YouTube. https://www.youtube.com/watch?v=wrtLyLwt51o
Long Descriptions
- Figure 11.2.1 Genetic maps for regions of two chromosomes from two species of the moth, Bombyx. The scale at left shows distance in cM, and the position of various loci is indicated on each chromosome. Diagonal lines connecting loci on different chromosomes show the position of corresponding loci in different species. This is referred to as regions of conserved synteny. [Back to Figure 11.2.1]
- Figure 11.2.2 A typical and simple gene map shows the relative distances among three genes, A, B and C. The distance between genes A and B is shown as 8 map units, the distance between genes B and C is shown as 12 map units, and therefore the distance between genes A and C is 20 map units. Gene B is located between genes A and C. [Back to Figure 11.2.2]
- Figure 11.2.3 Representation of the gametes that result when crossing over does not occur, or when one cross over occurs between non-sister chromosomes of a homologous pair — versus when a double crossover occurs between non-sister chromatids of a homologous pair. With single cross overs, recombinant genotypes are obtained, but with double cross overs, no recombinant genotypes are produced — only parental. Even though two crossovers have occurred, they cancel each other out, leading to only parental genotypes. [Back to Figure 11.2.3]

