12.4 Physical Maps
Human Genome Project (HGP)
In 2003, the HGP or Human Genome Project (which started in 1990) was completed. The HGP was an international collaborative endeavor, with the goal of determining the base pairs that comprise human DNA and sought to identify and map all the genes of the human genome from both a physical and a functional standpoint. The group of publicly funded researchers that eventually assembled was known as International Human Genome Sequencing Consortium (IHGSC). More than 18 different countries from across the globe had contributed to the Human Genome Project by the time of its completion. Determining the sequence of base pairs for each human chromosome allowed researchers to provide a more specific address than the cytogenetic location for many genes. A gene’s molecular location identifies that gene in terms of base pairs. It describes the gene’s precise position on a chromosome and indicates the size of the gene. Knowing the molecular location also allows researchers to determine exactly how far a gene is from other genes on the same chromosome. Different groups of researchers often determine slightly different values for a gene’s molecular location. Researchers interpret the sequence of the human genome using a variety of methods, which may result in slight differences in a gene’s molecular address.
Please visit The National Human Genome Research Institute to read more about the Human Genome Project.
The following TED Ed video, How to Sequence the Human Genome, presented by Mark J. Kiel (2013) on YouTube, discusses the Human genome and the Human Genome Project.
The ultimate physical map is an accurate representation of the DNA sequence of a genome. These days that sequence is usually held in a computer database and is accessible via the Internet. This wasn’t always the case. The first genome sequences were constructed from a series of large, cloned physical fragments of DNA. The map was, therefore, made from physical entities (pieces of DNA) rather than abstract concepts such as the linkage frequencies between genes that make up a genetic map. It is usually possible to correlate genetic and physical maps, for example, by identifying the clone that contains a particular molecular marker. The connection between physical and genetic maps allows the genes underlying particular mutations to be identified through a process call map-based cloning.

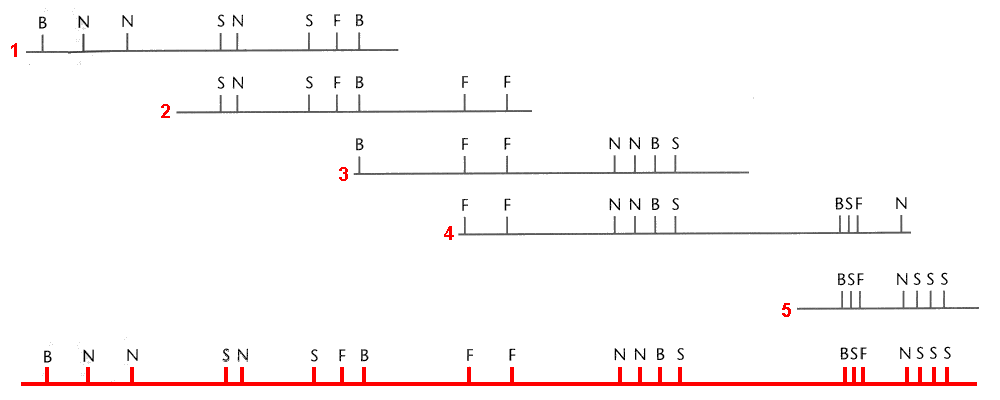
To create a physical map, large fragments of the genome are cloned into plasmid vectors, or into larger vectors called bacterial artificial chromosomes (BACs). BACs can contain approximately 100kb fragments. Typically, the set of sequences in a BAC clone library will contain redundant, overlapping sequences. Meaning that different clones will contain DNA from the same part of the genome so there are going to be some overlaps. Because of these overlaps, it is possible to select the minimum set of clones that represent the entire genome, and to order these clones respective to the sequence of the original chromosome. Note that this is all to be done without knowing the complete sequence of each BAC. A set of overlapping clones is called a contig. Making a contig map can rely on techniques related to Southern blotting: DNA from the ends of one BAC is used as a probe to find clones that contain the same sequence in another, overlapping BAC clone. These clones are then assumed to overlap each other. This process of finding overlaps can progress to position all the clones into overlapping series that span the genome. Also, if we already know the sequence of one strain of a simple organism, it can be used as a reference for mutant strains and can identify the differences in the sequences.

Small-sized, genome-like Lambda DNA is only 48kb long, but most chromosomes are Mb long. Currently, the only way to construct physical maps of large regions is through the joining of smaller regions to map a larger or whole portion of the chromosome. In order to do this, small, multiple copies of the chromosome have to be broken down into little pieces with different length and frames using restriction enzymes, so that they can partially overlap with each other. The continual overlaps of the fragments will eventually form a whole map of the chromosome. This contiguous assembly of clones is called contig.
Restriction Mapping Procedure
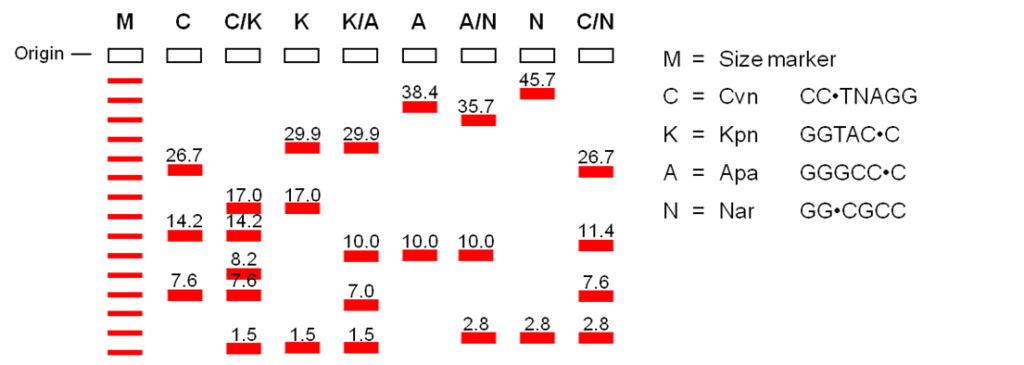
Restriction mapping is an inexpensive, quick, and easy method to describe a sample of cloned DNA. It is preferred over DNA sequencing for these reasons, but the sequence is still the ultimate description. Restriction mapping is the technique for identifying the location of restriction sites, relative to other sites on a DNA molecule. Typically, a sample of purified cloned DNA is aliquoted into several tubes and each is treated with several different restriction enzymes or combination of enzymes. These are then separated by agarose gel electrophoresis and the restriction fragment sizes determined by comparison to known size markers. By trial and error, the combination of fragments can be assembled like a linear jigsaw puzzle into a map of the restrictions sites – a restriction map (Figure 12.4.3). One can increase the resolution of the restriction site map by mapping more restriction sites.

Restriction mapping is also a quick, easy, and inexpensive way to characterize and distinguish DNA samples without actually sequencing the DNA; sequences can be represented by series of restriction sites and using this knowledge, one can tell if the DNA of interest is similar or different from others by comparing their degree of overlaps. Also, restriction sites offer positions for convenient manipulation of the DNA. Restriction fragments that contain the gene of interest can be cut out and once the gene is purified from the fragments, it can be sequenced or used as a probe. This is the reason why restriction mapping is still routinely used today, even though sequencing technologies allows us to sequence the whole genome.
Media Attributions
- Figure 12.4.1 Original attributed to NCBI-unknown (2017), public domain, Open Genetics Lectures
- Figure 12.4.2 Original by J. Locke (2017), CC BY-NC 3.0, Open Genetics Lectures
- Figure 12.4.3 Original by J. Locke (2017), CC BY-NC 3.0, Open Genetics Lectures
References
Locke, J. (2017). Figures: 6. A series of overlapping cloned sequences; and 7. By looking at the size of the fragments… [digital image]. In Locke, J., Harrington, M., Canham, L. and Min Ku Kang (Eds.), Open Genetics Lectures, Fall 2017 (Chapter 27, p. 5). Dataverse/ BCcampus. http://solr.bccampus.ca:8001/bcc/file/7a7b00f9-fb56-4c49-81a9-cfa3ad80e6d8/1/OpenGeneticsLectures_Fall2017.pdf
National Human Genome Research Institute. (n.d.). The human genome project (accessed January 18, 2022; last updated: December 22, 2020). National Institute of Health (NIH)/ United States Government. https://www.genome.gov/human-genome-project
NCBI-unknown. (2017). Figure 5. A portion of the physical map for human chromosome [digital image]. In Locke, J., Harrington, M., Canham, L. and Min Ku Kang (Eds.), Open Genetics Lectures, Fall 2017 (Chapter 27, p. 4). Dataverse/ BCcampus. http://solr.bccampus.ca:8001/bcc/file/7a7b00f9-fb56-4c49-81a9-cfa3ad80e6d8/1/OpenGeneticsLectures_Fall2017.pdf
TED-Ed. (2013, December 7). How to sequence the human genome – Mark J. Kiel (video file). YouTube. https://www.youtube.com/watch?v=MvuYATh7Y74
Long Descriptions
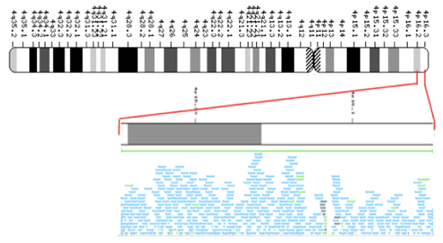
- Figure 12.4.1 A portion of the physical map for human chromosome 4. The entire chromosome is shown as a cytogenetic map and the resulting physical map is derived from a small identified portion of the original chromosome. [Back to Figure 12.4.1]
- Figure 12.4.2 A series of overlapping cloned sequences can be combined to eventually span much larger regions, including whole chromosomes, much like piecing together a puzzle, using individual pieces which overlap. [Back to Figure 12.4.2]
- Figure 12.4.3 By looking at the size of the fragments produced by one restriction enzyme or a combination of the restriction enzymes, the location and the order of the restriction site on a chromosome can be identified, forming a restriction map. [Back to Figure 12.4.3]


