5.2 Complementation Tests and Allelism
Mutant screening is one of the starting points geneticists use to investigate biological processes. Geneticists can observe two independently derived mutants with similar phenotypes, through a mutant screen or in natural populations. An immediate question from this observation is whether or not the mutant phenotype is due to a loss of function in the same gene, or are they mutant in different genes that both cause the same phenotype (e.g., in the same pathway). In other words, are they allelic mutations or non-allelic mutations, respectively? This question can be resolved using complementation tests, which bring together or combine, the two mutations under consideration into the same organism to assess the combined phenotype.

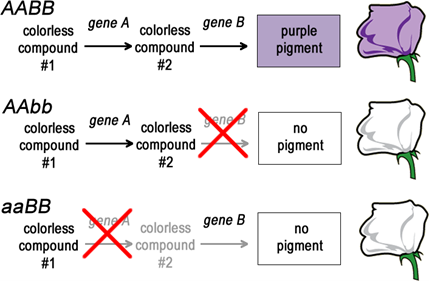
The easiest way to understand a complementation test is by example (Figure 5.2.1). The pigment in a purple flower could depend on a biochemical pathway much like the biochemical pathways leading to the production of arginine in Neurospora (Chapter 7). A diploid plant that lacks the function of gene A (genotype aa) would produce mutant white flowers that phenotypically looked just like the white flowers of a plant that lacked the function of gene B (genotype bb). Both A and B are enzymes in the same pathway that leads from a colourless compound #1, through colourless compound #2, to the purple pigment. Blocks at either step will result in a mutant white flower instead of the wild type purple flower.
Strains with mutations in gene A can be represented as the genotype aa, while strains with mutations in gene B can be represented as bb. Given that there are two genes here, A and B, then each of these mutant strains can be more completely represented as aaBB and AAbb. (LEARNING NOTE: Students often forget that genotypes usually only show mutant loci, however, one must remember all the other genes in the diploid genome are assumed to be wild type.)
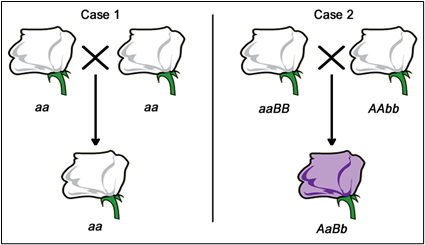
If these two strains are crossed together the resulting progeny will all be AaBb. They will have both a wild type, functional A gene and B gene and will thus have a pigmented, purple flower, a wild type phenotype. This is an example of complementation. Together, each strain provides what the other is lacking (AaBb). The mutations are in different genes and are thus called non-allelic mutations.
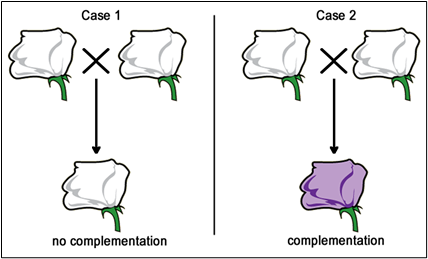
Now, if we are presented with a third pure-breeding, independently derived, white-flower, mutant strain, we won’t initially know if it is mutant in gene A, gene B, or some other gene altogether. We can use complementation testing to determine which gene is mutated. To perform a complementation test, two homozygous individuals with similar mutant phenotypes are crossed (Figures 5.2.2 & 5.2.3).
If the F1 progeny all have the same mutant phenotype (Case 1 – Figure 5.2.2), then we infer that the same gene is mutated in each parent. These mutations would then be called allelic mutations — mutant in the same gene locus. These two mutations FAIL to COMPLEMENT one another (still mutant). These could either be exactly the same mutant alleles (same base pair changes), or different mutations (different base pair changes, but in the same gene — allelic).
Conversely, if the F1 progeny all appear to be wild type (Case 2 — Figure 5.2.3), then each of the parents most likely carries a mutation in a different gene. These mutations would then be called non-allelic mutations — mutant in a different gene locus. These mutations DO COMPLEMENT one another.


Note: For mutations to be used in complementation tests they are (1) usually true-breeding (homozygous at the mutant locus), and (2) must be recessive mutations. Dominant and semi-dominant mutations CANNOT be used in complementation tests, since these mutations won’t show complementation effects of two non-allelic genes. (3) Note that haploid organisms like Neurospora cannot be used in complementation test since they have only one set of chromosome (4). Also, remember, some mutant strains may have more than one gene locus mutated and thus would fail to complement mutants from more than one other locus (or group).
Take a look at the following video, Complementation Testing, by Joseph Ross (2017), which explains how to perform and interpret complementation tests.
Media Attributions
- Figure 5.2.1 Original by Deyholos (2017), CC BY-NC 3.0, Open Genetics Lectures
- Figure 5.2.2 Original by Deyholos (2017), CC BY-NC 3.0, Open Genetics Lectures
- Figure 5.2.3 Original by Deyholos (2017), CC BY-NC 3.0, Open Genetics Lectures
References
Deyholos, M. (2017). Figures: 2. Simplified biochemical pathway, 3A. Observation, and 3B. Interpretation [diagrams]. In In Locke, J., Harrington, M., Canham, L. and Min Ku Kang (Eds.), Open Genetics Lectures, Fall 2017 (Chapter 4, p. 1-2). Dataverse/ BCcampus. http://solr.bccampus.ca:8001/bcc/file/7a7b00f9-fb56-4c49-81a9-cfa3ad80e6d8/1/OpenGeneticsLectures_Fall2017.pdf
Joseph Ross. (2017, July 10). Complementation testing (video file). YouTube. https://www.youtube.com/watch?v=knjxwahC6tY
Long Descriptions
- Figure 5.2.1 Three potential biochemical pathways in the production of flower colour in a particular organism, whereby this trait is governed by two different genes. In the first option, both genes (A and B) are active, thereby allowing the conversion of colourless compound 1 into colourless compound 2, and then conversion of colourless compound 2 into purple pigment, producing purple flowers. In the second option, gene B is inactive, and so no pigment results in white flowers. Similarly, in option 3, gene A is inactive, resulting in no pigment, and therefore white flowers are produced. [Back to Figure 5.2.1]
- Figure 5.2.2 The observations possible when conducting complementation tests. In the first case, two white flowers are mated to produce white flowered offspring, which indicates no complementation is occurring. In the second case, two white-flowered plants are mated to produce offspring with purple flowers, indicating that complementation is occurring in this case. [Back to Figure 5.2.2]
- Figure 5.2.3 Replica of Figure 5.2.2, except in this case, the potential genotypes of the organisms in the crosses of case 1 and case 2 are outlined. In case 1, both parents are aa, with offspring also being aa. In case 2, one parent is aaBB while the other is Aabb, giving rise to offspring AaBb. In case 1, all progeny would have the mutant phenotype, because they would all have the same, homozygous genotype as the parents. In Case 2, each parent has a mutation in a different gene, therefore none of the F1 progeny would be homozygous mutant at either locus. [Back to Figure 5.2.3]

