11.1 Introduction
Learning Objectives
- Construct a “genetic map” using appropriate data.
- Perform gene mapping utilizing recombination frequencies.
- Appreciate that double crossover events lead to an underestimation of map distance.
- Use three-point test crosses to map three linked genes.
- Calculate the coefficient of coincidence and interference.
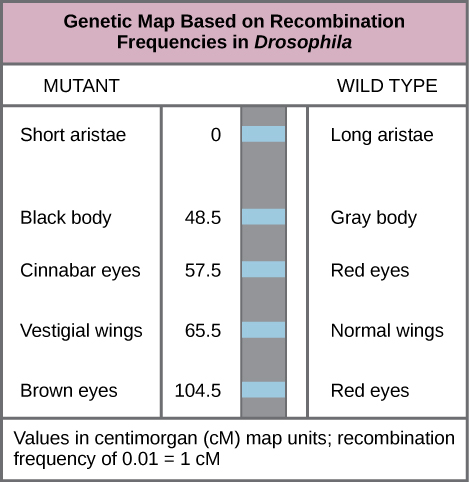
In this chapter, we will take a step back and look at the bigger picture of genes and chromosomes. “Genetic mapping”, otherwise known as “linkage mapping”, supplies geneticists with the evidence that a trait or disease which is passed from one generation to the next is linked to one or more genes. In addition, genetic maps also provide information regarding which chromosome contains the gene in question and where the gene lies on that chromosome. We will examine the use of recombination frequency (RF) data in constructing genetic maps (Figure 11.1.1), and also discuss the limitations of this technique based on events which occur during meiosis. We have already investigated the relative location of two loci by using the frequency of recombinants vs parentals to determine the recombinant frequency (RF). Two loci could show independent assortment (unlinked, RF~50%) or partial linkage (RF<~35%). If linked, the two genes must be located on the same chromosome (syntenic), but if unlinked they could be far apart on the same chromosome or on different chromosomes (non-syntenic). In this chapter, we will learn how to construct genetic maps using both 2-point crosses and 3-point crosses.

Media Attribution
- Figure 11.1.1 Figure 13 01 03 by Rye et al. (2016), CNX OpenStax, CC BY 4.0, via Wikimedia Commons
References
Rye, C. et al. (2016, October 21). Figure 13.4 This genetic map orders Drosophila genes on the basis of recombination frequency [digital image]. In OpenStax Biology. https://openstax.org/books/biology/pages/13-1-chromosomal-theory-and-genetic-linkage
Long Description
- Figure 11.1.1 Example of a genetic map based on recombination frequencies in the fruit fly. Differences between phenotypes in the mutant and wildtype are shown for the trials being mapped. For instance, aristae length is short in the mutant, but long on the wild type. Body colour is black in the mutant but grey in the wild-type. The map units are provided in centimorgans (cM), whereby a recombination frequency of 0.01 corresponds to 1 centimorgan. [Back to Figure 11.1.1]

