5.3 Complementation Groups = Groups of Allelic Mutations
So, with the third mutant strain above, we could assign it to be allelic with either gene A or gene B, or some other locus, should it complement both gene A and gene B mutations. If they came from different natural populations or from independently mutagenized individuals, we could have a fourth, fifth, sixth, etc. white flower strain, then we could begin to organize the allelic mutations into groups, which are called complementation groups. These are groups of mutations that FAIL TO COMPLEMENT one another (a group of NON-complementing mutations) and are assumed to have mutations in the SAME gene; hence they are grouped as complementation group. A group can consist of as few as one mutation and as many as all the mutants under study. Each group represents a set of mutations in the same gene (allelic). The number of complementation groups represents the number of genes that are represented in the total collection of mutations.
It all depends on how many mutations you have in a gene. For example, the white gene in Drosophila has >300 different mutations within the white gene described in the literature. If you were to obtain and cross all these mutations to themselves, you would find they all belonged to the same complementation group or same white gene. Each complementation group represents a gene.
If, however, you obtained a different mutation, vestigial for example, which affects wing growth, and crossed it to a white eye-colour mutation, the double heterozygote would result in red eyes and normal wings (wild type for both characters) so the two would complement and represent two different complementation groups: (1) white, (2) vestigial. The same would be true for the other eye-colour mutations mentioned elsewhere in this text. For example, if you crossed a scarlet eye-colour mutant to a white eye-colour mutant, the double heterozygote would have wild type red eyes. Each mutant has the wild type allele of the other. Again, remember that all the other genes in the diploid genome are assumed to be wild type.
To drive home the concept of complementation groups, we will look at two hypothetical examples.
Example 1: Multiple Mutant Complementation Test
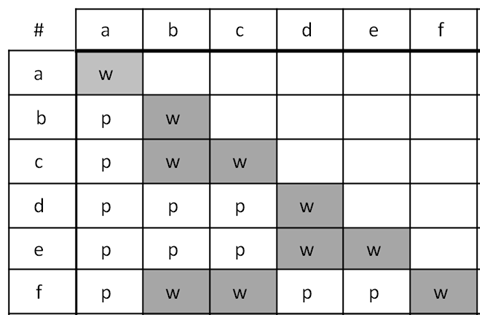
The first example (Figure 5.3.1) shows the results of a series of crosses as a complementation test table with six mutants labelled a to f. The mutants fall into three complementation groups in total: (1) a (2) b, c, f, and (3) d, e. Notice that a complementation group can consist of only one mutant, or more than one.

Example 2: Double Hit Strain
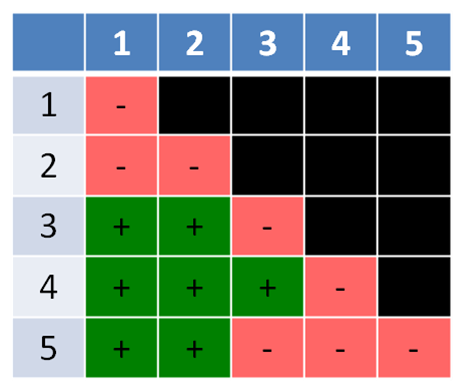
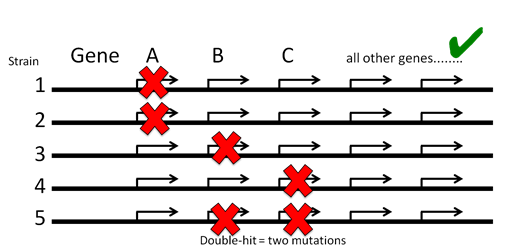
The second example (Figure 5.3.2) is similar, but has a twist. It has five mutants labelled 1-5, with 1-4 being mutations in only a single gene each, while mutant #5 has mutations in two different genes, and thus is unable to complement the mutations in two, different genes. A double-hit strain like strain #5 is normally a very rare event, but is included here to make a point. A double-hit strain may appear to belong in two different groups. In this case, mutants #3 and #4 complement (different genes) but #5 fails to complement both #3 and #4, indicating it has mutations in both the mutant genes in #3 (gene B) and #4 (gene C) (Figure 5.3.3).


Media Attributions
- Figure 5.3.1 Original by Di Cara (2017), CC BY-NC 3.0, Open Genetics Lectures
- Figure 5.3.2 Original by Locke (2017), CC BY-NC 3.0, Open Genetics Lectures
- Figure 5.3.3 Original by Locke (2017), CC BY-NC 3.0, Open Genetics Lectures
References
Di Cara. (2017). Figure 4. Complementation test table [diagrams]. In Locke, J., Harrington, M., Canham, L. and Min Ku Kang (Eds.), Open Genetics Lectures, Fall 2017 (Chapter 4, p. 3). Dataverse/ BCcampus. http://solr.bccampus.ca:8001/bcc/file/7a7b00f9-fb56-4c49-81a9-cfa3ad80e6d8/1/OpenGeneticsLectures_Fall2017.pdf
Locke, J. (2017). Figures: 5. Complementation test table with pink as mutant, and 6. Chromosomes of the organisms that are used…[diagrams]. In Locke, J., Harrington, M., Canham, L. and Min Ku Kang (Eds.), Open Genetics Lectures, Fall 2017 (Chapter 4, p. 4). Dataverse/ BCcampus. http://solr.bccampus.ca:8001/bcc/file/7a7b00f9-fb56-4c49-81a9-cfa3ad80e6d8/1/OpenGeneticsLectures_Fall2017.pdf
Long Descriptions
- Figure 5.3.1 A grid shows the crosses conducted when carrying out complementation testing, and how results are depicted. In this case, the top row and left-hand column outline the various mutants, listed from a to f. In the resulting boxes upon mating, offspring are indicated as “w” which stands for the white flowers, which is mutant (no complementation) and “p”, which stands for purple, which represents wild type (complementation). Boxes are left blank if no crosses are done for that pair of mutants. [Back to Figure 5.3.1]
- Figure 5.3.2 Similar to Figure 5.3.1, except the mutants are listed in the top row and left-hand column from 1 to 5, and the results of the crosses between each pair of mutants indicated by a plus sign (+) to indicate complementation is occurring, or a negative sign (-) to indicate no complementation is taking place. Boxes shaded back indicate those two mutants were not crossed. [Back to Figure 5.3.2]
- Figure 5.3.3 Five solid back lines represent strains (1 to 5), each containing a number of genes, A, B, C etc. In strain 1, gene A is not active, represented by a red cross over that gene. The same is shown for strain 2. In strain 3, gene B is inactive, and in strain 4, gene C is inactive. Finally, in strain 5, genes B and C are inactive. This image represents how different organisms can be used in complementation tests to determine if genes are allelic or non-allelic. [Back to Figure 5.3.3]

