12.3 Cytogenetic Maps
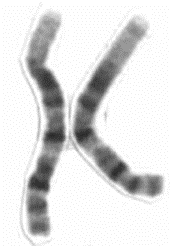
Cytogenetics is sometimes referred to as a branch of genetics which deals with how chromosomes relate to cell behaviour, particularly during mitosis and meiosis. A cytogenetic map is produced after staining metaphase chromosomes with a particular dye mixture and visualizing the dark and light-coloured bands under microscope. Each chromosome pair stains with its own characteristic banding pattern. The bands correlate approximately with the DNA sequence underlying it: AT-rich areas stain darkly, GC-rich areas lightly. To cytologically describe a chromosome is to describe its length, centromere position, and banding pattern after staining. Cytogeneticists can observe chromosomes at any stage of the cell cycle but those from metaphase cells provide the most detail and clarity. Figure 12.3.1 shows a more magnified view of a pair of chromosomes. On average, a condensed human metaphase chromosome is 5 µm long and each chromatid is 700 nm wide. In contrast, a decondensed interphase chromosome is 2 mm long and only 30 nm wide, yet still fits into a single nucleus.

Karyograms
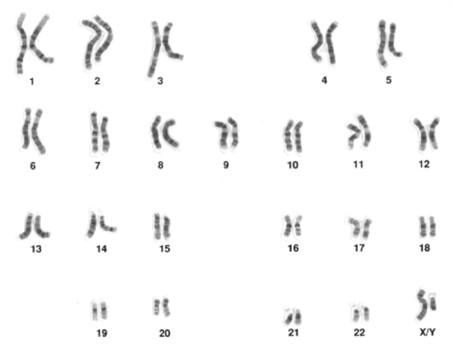
Human cytogeneticists use metaphase chromosome spreads as a standard representation of the chromosomes in a cell, organism, or species. Comparisons permit them to identify chromosome abnormalities. Because it can be hard to distinguish individual chromosomes, cytogeneticists sort the photo to put the chromosomes into a standard pattern. The result is a karyogram (“nucleus picture”; Figure 12.3.2). In the past, it was necessary to print a photograph of the metaphase spread, cut out each chromosome with scissors, and then glue each to a piece of cardboard to show the pattern. Now, computer software does much of this for us, but the karyogram assembly is usually reviewed by a qualified cytogeneticist. Each eukaryotic species has its nuclear genome divided among a number of chromosomes that is characteristic of that species. For example, a haploid human nucleus (i.e., sperm or egg) normally has 23 chromosomes (n=23), and a diploid human nucleus has 23 pairs of chromosomes (2n=46). A karyotype is the complete set of chromosomes of an individual. In Figure 12.3.2, the cell was in metaphase so each of the 46 structures is a replicated chromosome even though it is hard to see the two sister chromatids for each chromosome at this resolution. As expected, there are 46 chromosomes. Note that the chromosomes have different lengths. In fact, human chromosomes were named based upon this feature. Our largest chromosome is called 1, our next longest is 2, and so on.

Take a look at the video below, Gene Mapping/ How to Decode 13q14.3, by Medinaz (2017) on YouTube, which discusses cytogenetic mapping.
The chromosomes are numbered to distinguish them. Chromosomes 1 through 22 are autosomes, which are present in two copies in both males and females. Because human chromosomes vary in size, this was the easiest way to label them. Our largest chromosome is number 1, our next longest is 2, and so on. The karyogram above shows two copies of each of the autosomes. A karyogram from a normal female would also show these 22 pairs. There are also the sex-chromosomes, X and Y. Normal females have two X-chromosomes, while normal males have an X and a Y each. They act as a homologous pair, similar to the autosomes. During meiosis, only one of each autosome pair and one of the sex-chromosomes makes it into the gamete. This is how 2n = 46 adults can produce 1n = 23 eggs or sperm. In addition to their length, Cytogeneticists can distinguish chromosomes using their centromere position and banding pattern. Note that at the resolution in Figure 12.3.2, both chromosome 1’s look identical, even though at the base pair level there are small, and often significant, differences in the sequence that correspond to allelic differences between these homologous chromosomes. Remember that in each karyogram there are maternal chromosomes, those inherited from their mother, and paternal chromosomes, those from their father. For example, everyone has one maternal chromosome 1 and one paternal chromosome 1. In a typical karyogram, it is usually not possible to tell which is which. In some cases, however, there are visible differences between homologous chromosomes that do permit the distinction to be made.
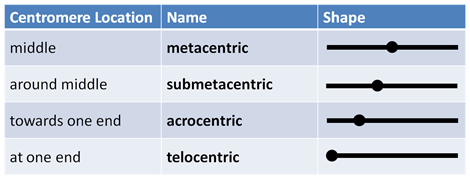
A chromosome has a telomere and centromere, which are usually in a heterochromatin state. Centromere is DNA sequences that are bound by centromeric proteins that link the centromere to microtubules. Centromere can be in the middle (metacentric), near to the middle (submetacentric), near the end (acrocentric), at the end (telocentric) or the entire chromosome can act as a chromosome (holocentric). Telomeres are repetitive sequences like TTAGGG at the end of the chromosomes that help maintain the length of the chromosome. Another feature is that, in a chromosome, there are p arm (petite = small) and q arm (queue = tail or just the next letter in the alphabet).

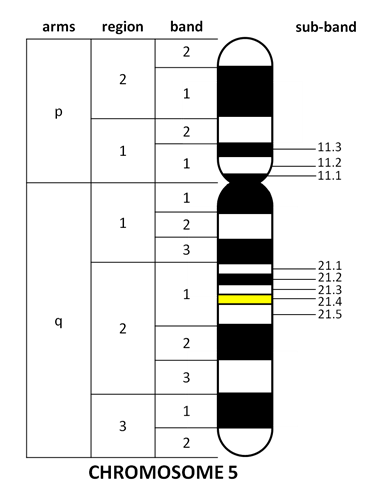
Various stains and fluorescent dyes like Trypsin+Giesma and Quinacrine are used to produce characteristic banding patterns to distinguish all 23 chromosomes. These bands are first grouped in regions, sectioned into bands, and further divided into sub-bands. Notice that the band numbers start from the centromere and extend towards the tip of each arm (Figure 12.3.4). The number of chromosomes varies between species, but there appears to be very little correlation between chromosome number and either the complexity of an organism or its total amount of genomic DNA.

Here is another video on cytogenetic mapping by SCOOTERDMU (2011) on YouTube, Genetics – Cytogenetic Maps Part 6 of 6.
Media Attributions
- Figure 12.3.1 Human male karyotpe high resolution – Chromosome 1 cropped by National Human Genome Research Institute/ Talking Glossary of Genetics, public domain, via Wikipedia
- Figure 12.3.2 Human male karyotpe high resolution by National Human Genome Research Institute/ Talking Glossary of Genetics, public domain, via Wikipedia
- Figure 12.3.3 Original (table) by Harrington/Kang (2017), CC BY-NC 3.0, Open Genetics Lectures
- Figure 12.3.4 Original by Kang (2017), CC BY-NC 3.0, Open Genetics Lectures
References
Harrington, M., Kang, M. K. (2017). Table 1. Table showing four types of centromere location [digital image]. In Locke, J., Harrington, M., Canham, L. and Min Ku Kang (Eds.), Open Genetics Lectures, Fall 2017 (Chapter 27, p. 2). Dataverse/ BCcampus. http://solr.bccampus.ca:8001/bcc/file/7a7b00f9-fb56-4c49-81a9-cfa3ad80e6d8/1/OpenGeneticsLectures_Fall2017.pdf
Kang, M. K. (2017). Figure 4. Fictional diagram of a human chromosome and its bands …[digital image]. In Locke, J., Harrington, M., Canham, L. and Min Ku Kang (Eds.), Open Genetics Lectures, Fall 2017 (Chapter 27, p. 3). Dataverse/ BCcampus. http://solr.bccampus.ca:8001/bcc/file/7a7b00f9-fb56-4c49-81a9-cfa3ad80e6d8/1/OpenGeneticsLectures_Fall2017.pdf
Medinaz. (2017). Gene mapping/ How to decode 13q14.3 (video file). YouTube. https://www.youtube.com/watch?v=gGUxf-aL1DA
SCOOTERDMU (2011). Genetics – Cytogenetic maps Part 6 of 6. YouTube. https://www.youtube.com/watch?v=DjJEYzAyjJY
Long Descriptions
- Figure 12.3.1 A pair of homologous chromosomes (human chromosome 1) which are metacentric. The pair stains with its own characteristic banding pattern. The bands correlate approximately with the DNA sequence underlying it: AT-rich areas stain darkly, GC-rich areas lightly. [Back to Figure 12.3.1]
- Figure 12.3.2 A karyogram, which is a visualization of all the chromosomes in their condensed state of a cell in a particular organism. Twenty-three pairs of chromosomes are observed in a somatic cell of a human male — we see 22 pairs of autosomes and one pair of sex-chromosomes which are labelled XY. The Y chromosome is seen to be significantly smaller than the X chromosome. [Back to Figure 12.3.2]
- Figure 12.3.3 Representation of the four main types of chromosomes in terms of centromere position: metacentric chromosomes have centromeres at the middle, submetacentric have centromeres slightly away but around the middle, acrocentric chromosomes have centromeres towards one end, and telocentric chromosomes have centromeres at one end. [Back to Figure 12.3.3]
- Figure 12.3.4 Fictional diagram of a human chromosome and its bands. A chromosome has p and q arm, which are both divided by regions. These regions are divided by bands, and these bands are subdivided into sub-bands. The bands are numbered away from the centromere, and sub-bands are renumbered for each bands. So the division goes arm, region, band and then sub-band. [Back to Figure 12.3.4]

