4.2 Symbols used in Pedigree Charts
Pedigree charts are diagrams that show the phenotypes and/or genotypes for a particular organism, its ancestors, and descendants.
In order to glean useful information from a Pedigree Chart, the signs and symbols used to construct the chart must be properly recognized and interpreted. Sufficient information must be given via the Chart, and sometimes, supplementary information is also required (e.g., the frequency at which the particular trait is found in the population from which the family is derived). Geneticists use a standardized set of symbols to represent an individual’s sex, family relationships, and phenotype. These diagrams are used to determine the mode of inheritance of a particular disease or trait, and to predict the probability of its appearance among offspring. Pedigree analysis is therefore an important tool in basic research, agriculture, and genetic counselling.
Each pedigree chart represents all the available information about the inheritance of a single trait (most often a disease) within a family. The pedigree chart is therefore drawn using phenotypic information, but there is always some possibility of errors in this information, especially when relying on family members’ recollections or even clinical diagnoses. In real pedigrees, further complications can arise due to incomplete penetrance (including age of onset) and variable expressivity of disease alleles, but for the examples presented in this book, we will presume complete accuracy of the pedigrees — that is, the phenotype accurately reflects the genotype. A pedigree may be drawn when trying to determine the nature of a newly discovered disease, or when an individual with a family history of a disease wants to know the probability of passing the disease on to their children. In either case, a tree is drawn, as shown in Figure 4.2.1, with circles to represent females, and squares to represent males. Matings are drawn as a line joining a male and female, while a consanguineous mating (closely related) is two lines.
The affected individual that brings the family to the attention of a geneticist is called the proband (or propositus). If the individual is unaffected, they are called the consultand. If an individual is known to have symptoms of the disease (affected), the symbol is filled in. Sometimes, a half filled-in symbol is used to indicate a known carrier of a disease; this is someone who does not have any symptoms of the disease, but who passed the disease on to subsequent generations because they are a heterozygote. Female carriers of X-linked traits are indicated by a circle with a dot in the centre. Note, that when a pedigree is constructed, it is often unknown whether a particular individual is a carrier or not, so not all carriers are always explicitly indicated in a pedigree. For simplicity, in this chapter we will assume that the pedigrees presented are accurate, and represent fully penetrant traits. If possible, the male partner should be left of female partner on relationship line. Siblings should be listed from left to right in birth order, oldest to youngest.
Media Attributions
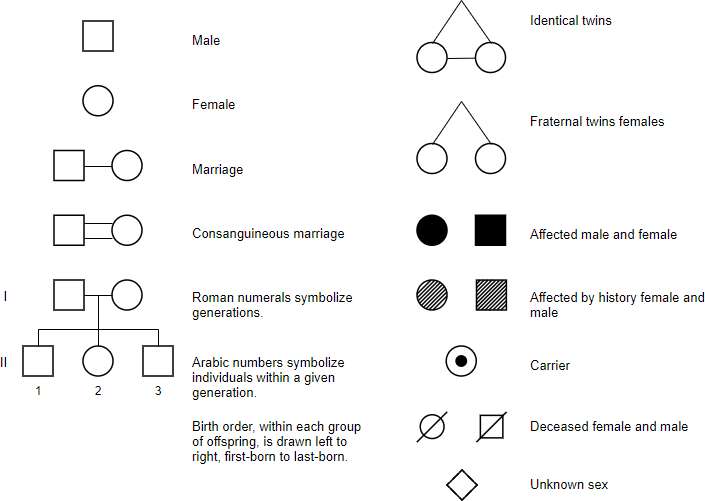
- Figure 4.2.1 Symbols used in constructing a pedigree chart by John Locke (2019), CC BY-NC-SA 3.0
Long Description
- Figure 4.2.1 Symbols are used to construct pedigree charts. The major ones are as follows: male – square; female – circle; marriage – square and circle linked by a horizontal line; affected male – shaded square; affected female – shaded circle; carrier – circle or square with a dot inside; deceased – circle or square with a line running through it; unknown sex – a diamond; Roman numerals symbolize generations, and Arabic numbers symbolize individuals within a given generation; birth order within each group of offspring is drawn left to right, from first-born to last-born. [Back to Figure 4.2.1]
