12.2 Genetic Maps
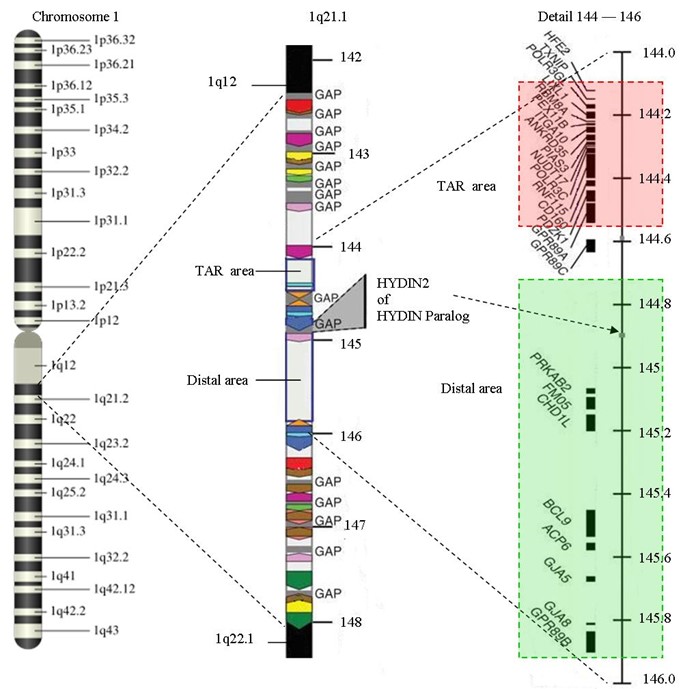
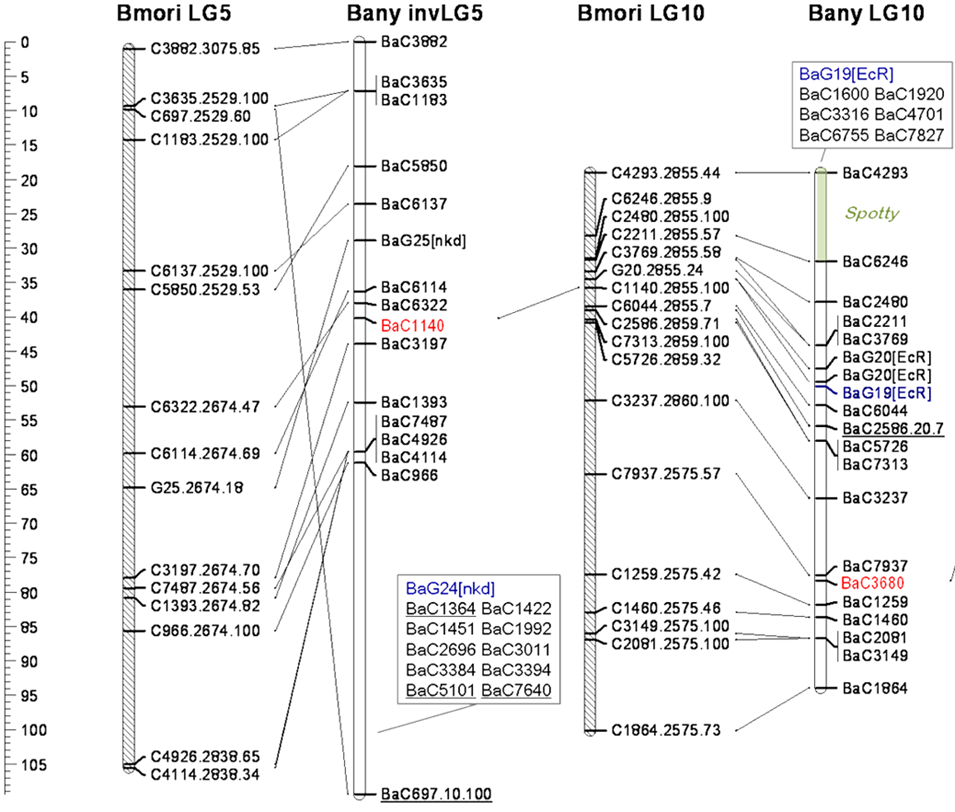
We have already explored units of genetic distance (map units/centiMorgans, cM) and how this relates to recombination frequency. We can use this information in order to produce a genetic map; a “map” that shows the locations of genes along a linear chromosome. Note that map distances are always calculated for one pair of loci at a time. However, by combining the results of multiple pair-wise calculations, a genetic map of many loci on a chromosome can be produced (Figures 12.2.1 & 12.2.2). A genetic map shows the map distance, in cM, that separates any two loci, and the position of these loci relative to all other mapped loci. The genetic map distance is roughly proportional to the physical distance, i.e., the amount of DNA between two loci. For example, in Arabidopsis, 1.0 cM corresponds to approximately 150,000 bp and contains approximately 50 genes. The exact number of DNA bases in a cM depends on the organism, and on the particular position in the chromosome. Some parts of chromosomes (“crossover hot spots”) have higher rates of recombination than others, while other regions have reduced crossing over and often correspond to large regions of heterochromatin.


When a novel gene or locus is identified by mutation or polymorphism, its approximate position on a chromosome can be determined by crossing it with previously mapped genes, and then calculating the recombination frequency. If the novel gene and the previously mapped genes show complete or partial linkage, the recombination frequency will indicate the approximate position of the novel gene within the genetic map. This information is useful in isolating (i.e., cloning) the specific fragment of DNA that encodes the novel gene, through a process called map-based cloning. Genetic maps are also useful to track genes/alleles in breeding crops and animals, in studying evolutionary relationships between species, and in determining the causes and individual susceptibility of some human diseases.
Watch the video below, 8H – Physical and Genetic Linkage and Maps, presented by Professor Redfield (Useful Genetics, 2015) of UBC, which discusses genetic mapping.
Examples of Genes in Humans
LCT – An Autosomal Gene
The LCT gene encodes the enzyme Lactase. This enzyme allows people to digest the milk sugar lactose. The LCT gene is on chromosome 2. Because this is an autosome, everyone has a maternal and a paternal copy of the LCT gene. Genes come in different versions called alleles. The allele of the LCT gene you inherited from your mother will probably be slightly different from the allele you received from your father. Thus, most people have two different alleles of this gene. If we consider a cell in G1 there will be two pieces of DNA inside the nucleus that harbour this gene. When this cell completes DNA replication there will be four copies of this gene. But because the chromatids on your maternal chromosome 2 are identical, as are the chromatids on your paternal chromosome 2, this cell will still have just two different alleles. Because of this, we simplify things by saying that humans have two copies of LCT. Since most genes are on autosomes, you have two copies of most of your genes.
F8 – An x Chromosomal Gene
The F8 gene makes a blood-clotting protein called Coagulation Factor VIII (F8). Without normal F8 a person is unable to stop bleeding if injured. The F8 gene is located on the X chromosome. Females, with two X chromosomes, have two copies of the F8 gene. Males only have one X chromosome and thus a single F8 gene. This has an impact on male health, a topic discussed in Chapter 4 on pedigree analysis.
SRY – A y Chromosomal Gene
The SRY gene is only found in males, because it is located on the Y chromosome (See Chapter 10). Males have this gene and females do not. In embryogenesis, the presence this gene leads to being male. Its absence leads to being female. A pair of organs called the gonads can develop into either ovaries or testes. In XY embryos the SRY gene makes a protein that causes the gonads to develop into testes. Conversely, XX embryos do not have this gene and their gonads develop into ovaries instead. Once formed the testes produce sex hormones that direct the rest of the developing embryo to become male, while the ovaries make different sex hormones that promote female development. The testes and ovaries are also the organs where gametes (sperm or eggs) are produced. Whether a person is genetically male or female is decided at the moment of conception, if the sperm carries a Y chromosome the result is a male and if the sperm carries an X the result is a female.
MT-CO1 – A Mitochondrial Gene
The MT-CO1 gene is located on the mtDNA chromosome. It encodes a protein in Complex IV of the mitochondrial electron transport chain. For reasons that are not clear, this protein must be made in the mitochondria. It cannot be synthesized in the cytosol of the cell and then imported into the mitochondria, as is the case, with most mitochondrial proteins. Because humans generally receive their mitochondria from their mother, everyone has only one MT-CO1 gene. It is the same one found in their mother (and her mother). Technically speaking we have only one MT-CO1 allele, it will be identical on all of the mtDNA molecules, in all of the mitochondria, in all of the cells.
In summary:
| Location of a gene | Number of alleles of this gene in males |
Number of alleles of this gene in females |
|---|---|---|
| Autosomal chromosome | 2 | 2 |
| X chromosome | 1 | 2 |
| Y chromosome | 1 | 0 |
| Mitochondrial chromosome | 1 | 1 |
Media Attributions
- Figure 12.2.1 Chromosome 1 to 1q21.1 by SpelgroepPhoenix, CC BY-SA 3.0, via Wikimedia Commons
- Figure 12.2.2 Figure 3 attributed to NCBI-NIH (2017), public domain, Open Genetics Lectures, modified from original from Beldade et al (2009).
References
Beldade, P., Saenko, S. V., Pul, N., Long, A. D. (2009, February). Figure 3. A gene-based linkage map for bicyclus anynana butterflies allows for a comprehensive analysis of synteny with the lepidopteran reference genome [digital image]. PLOS Genetics 5(2): e1000366. https://doi.org/10.1371/journal.pgen.1000366.g003
NCBI-NIH. (2017). Figure 3. Genetic maps for regions of two chromosomes…[digital image]. In Locke, J., Harrington, M., Canham, L. and Min Ku Kang (Eds.), Open Genetics Lectures, Fall 2017 (Chapter 19, p. 2). Dataverse/ BCcampus.http://solr.bccampus.ca:8001/bcc/file/7a7b00f9-fb56-4c49-81a9-cfa3ad80e6d8/1/OpenGeneticsLectures_Fall2017.pdf
Redfield, R./ UBC [Useful Genetics]. (2015, August 23). 8H – Physical and genetic linkage and maps (video file). YouTube. https://www.youtube.com/watch?v=ssbKpbv6t_w
Media Attributions
- Figure 12.2.1 Genetic map of the human chromosome 1, showing in the first instance, a cytogenetic map, with various regions identified based on their position on the chromosome (p arm or q arm), then, one of these regions is expanded to show the numerous areas which lie within this region, and then, an even smaller sub-region is expanded to show the details of the genes within. [Back to Figure 12.2.1]
- Figure 12.2.2 Genetic Maps for Regions of Two Chromosomes from Two Species of the Silk Moth, Bombyx. The scale at left shows distance in cM, and the position of various loci is indicated on each chromosome. Diagonal lines connecting loci on different chromosomes show the position of corresponding loci in different species. This is referred to as regions of conserved synteny. [Back to Figure 12.2.2]

