1.6 Single Locus Test Crosses
Knowing the genotypes of an individual is an important part of a genetic experiment. However, genotypes cannot be observed directly; they must be inferred based on phenotypes. Because of dominance, it is often not possible to distinguish between a heterozygote and a homozygote based on phenotype alone (e.g., see the purple-flowered F2 plants). To determine the genotype of a specific individual, a test cross can be performed in which the individual with an unknown genotype is crossed with an individual that is homozygous recessive for all of the loci being tested.
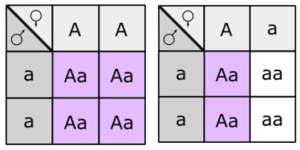
For example, if you were given a pea plant with purple flowers it might be a homozygote (AA) or a heterozygote (Aa). You could cross this purple-flowered plant to a white-flowered plant as a tester, since you know the genotype of the tester is aa. Depending on the genotype of the purple-flowered parent (Figure 1.6.1), you will observe one of two phenotypic ratios in the F1 generation. If the purple-flowered parent was a homozygote AA, all of the F1 progeny will be purple. If the purple-flowered parent was a heterozygote Aa, the F1 progeny should segregate purple-flowered and white-flowered plants in a 1:1 ratio.

Take a look at the video, Testcross Explained, by Nicole Lantz (2020) on YouTube, which outlines monohybrid test crosses.
Media Attribution
- Figure 1.6.1 Original by L. Canham (2017), CC BY-NC 3.0, Online Open Genetics
References
Canham, L. (2017). Figure 10. Punnett squares showing the two possible outcomes of a single locus test cross [diagram]. In Locke, J., Harrington, M., Canham, L. and Min Ku Kang (Eds.), Open Genetics Lectures, Fall 2017 (Chapter 16, p. 9). Dataverse/ BCcampus. http://solr.bccampus.ca:8001/bcc/file/7a7b00f9-fb56-4c49-81a9-cfa3ad80e6d8/1/OpenGeneticsLectures_Fall2017.pdf
Nicole Lantz. (2020, April 14). Testcross explained [Video file]. YouTube. https://www.youtube.com/watch?v=8y_SLtToUOA&feature=youtu.be.
Long Description
- Figure 1.6.1 Two Punnett squares are shown, each as a square containing nine smaller squares. One Punnett square shows the production of alleles from a homozygous dominant parent (AA) and a homozygous recessive parent (aa), to produce four offspring which are all heterozygous (Aa). The other Punnett square shows the production of alleles from a heterozygous parent (Aa) and a homozygous recessive parent (aa) to produce offspring in a 1:1 ratio between heterozygous (Aa) and homozygous recessive (aa). [Back to Figure 1.6.1]

