3.4 Amount of DNA (c-value) and Number of Chromosomes (n-value)
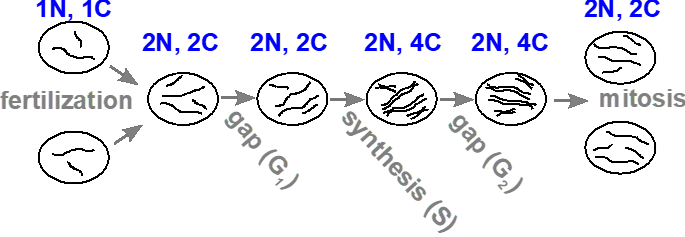
The amount of DNA within a cell changes during the following events: fertilization, DNA synthesis and mitosis (Figure 3.4.1). We use “c” (or C) to represent the DNA content in a cell, and “n” (or N) to represent the number of complete sets of chromosomes. In a haploid gamete (i.e., sperm or egg), the amount of DNA is 1c, and the number of chromosomes is 1n. Upon fertilization, both the DNA content and the number of chromosomes in the diploid zygote doubles to 2c and 2n, respectively. Following DNA replication, the DNA content doubles again to 4c, but each pair of sister chromatids are still attached by the centromere, and so is still counted as a single chromosome (a replicated chromosome), so the number of chromosomes remains unchanged at 2n. If the cell undergoes mitosis, each daughter cell will return to 2c and 2n, because it will receive half of the DNA, and one of each pair of sister chromatids.


The c-Value of the Nuclear Genome
The complete set of DNA within the nucleus of any organism is called its nuclear genome and is measured as the c-value in units of either the number of base pairs or picograms of DNA. There is a general correlation between the nuclear DNA content of a genome (i.e., the C-value) and the physical size or complexity of an organism. Compare the size of E. coli and humans, for example, in the Table 3.4.1 There are, however, many exceptions to this generalization, such as the human genome contains only [latex]{3.2}\times{109}[/latex] DNA bases, while the wheat genome contains [latex]{17}\times{109}[/latex] DNA bases — almost 6 times as much. The Marbled Lungfish (Protopterus aethiopicus – Figure 3.4.3) contains ~[latex]{133}\times{109}[/latex] DNA bases, (~45 times as much as a human) and a fresh water amoeboid, Polychaos dubium, has as much as [latex]{670}\times{109}[/latex] bases ([latex]{200}\times[/latex] a human).

| Organism | DNA Content (Mb, 1C) | Estimated Gene Number | Average Gene Density | Chromosome Number (1N) |
|---|---|---|---|---|
| Homo sapiens | 3,200 | 25,000 | 100,000 | 23 |
| Mus musculus | 2,600 | 25,000 | 100,000 | 20 |
| Drosophila melanogaster | 140 | 13,000 | 9,000 | 4 |
| Arabidopsis thaliana | 130 | 25,000 | 4,000 | 5 |
| Caenorhabditis elegans | 100 | 19,000 | 5,000 | 6 |
| Saccharomyces cerevisiae | 12 | 6,000 | 2,000 | 16 |
| Escherichia coli | 5 | 3,200 | 1,400 | 1 |
The c-Value Paradox
This apparent paradox (called the C-value paradox) can be explained by the fact that not all nuclear DNA encodes genes — much of the DNA in larger genomes is non-gene coding. In fact, in many organisms, genes are separated from each other by long stretches of DNA that do not code for genes or any other genetic information. Much of this “non-gene” DNA consists of transposable elements of various types, which are an interesting class of self-replicating DNA elements. Other non-gene DNA includes short, highly repetitive sequences of various types. Together, this non-functional DNA is often referred to as “Junk DNA”.
The “Onion Test”
This “test” deals with any proposed explanation for the function(s) of non-coding (junk) DNA. For any proposed function for the excess of DNA in eukaryote genomes (c-value paradox), can it “explain why an onion needs about five times more non-coding DNA for this function than a human?” The onion, Allium cepa, has a haploid genome size of ~17 pg, while humans have only ~3.5 pg. Why? Also, onion species range from 7 to 31.5 pg, so why is there this range of genome size in organisms of similar complexity?
The term “onion test” was first coined in April 2007 by T. Ryan Gregory, the Canadian evolutionary biologist and genome biologist. For an interesting alternative view of the onion test, see Jonathan McLatchie’s (2011) article, “Why the “Onion Test” Fails as an Argument for “Junk DNA”” on the Evolution News website.

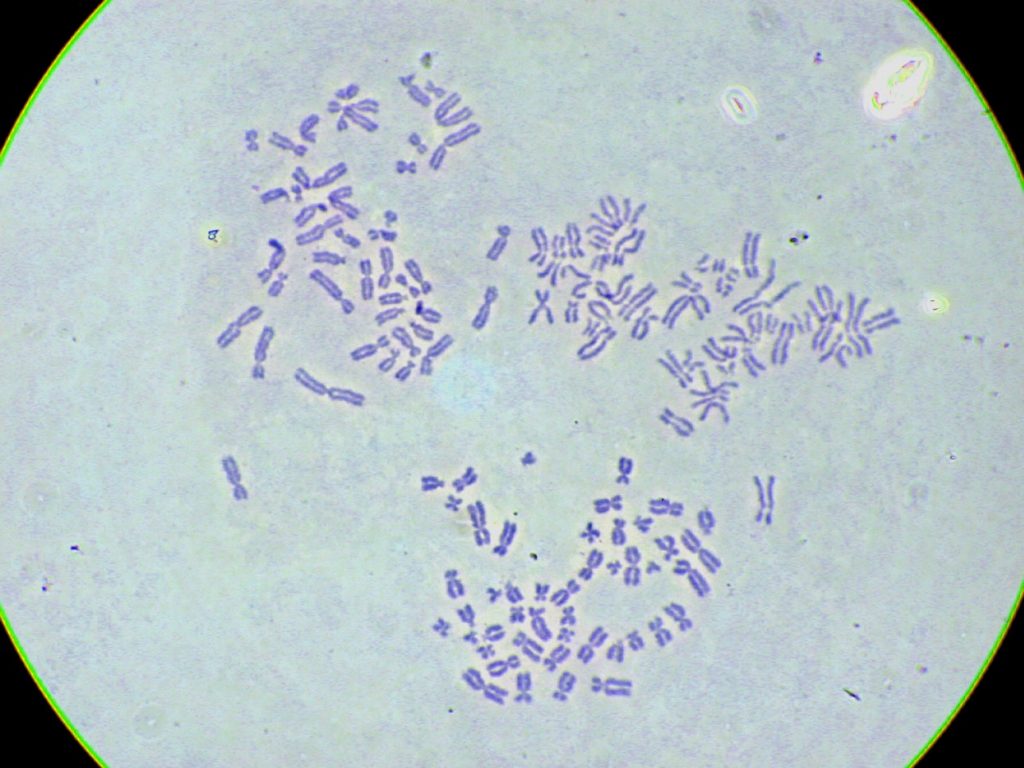
To calculate how much DNA is seen in the nuclei in Figure 3.4.4, consider that a human gamete has about 3000 million base pairs. We can shorten this statement to 1c = 3000 Mb where c is the c‑value, the DNA content in a gamete. When an egg and sperm join the resulting zygote is 2c = 6000 Mb. Before the zygote can divide and become two cells it must undergo DNA replication. This doubles the DNA content to 4c = 12 000 Mb. When the zygote divides, each daughter cell inherits half the DNA and is therefore back to 2c = 6000 Mb. Then each cell will become 4c again (replication) before dividing themselves to become 2c each. From this point forward, every cell in the embryo will be 2c = 6000 Mb before its S phase and 4c = 12 000 Mb afterwards. The same is true for the cells of fetuses, children, and adults. Because the cells used to prepare this chromosome spread were adult cells in metaphase each is 4c = 12 000 Mb. Note, there are some rare exceptions, such as some stages of meiocytes that make germ cells and other rare situations like the polyploidy of terminally differentiated liver cells.
In summary:
| Human Cell | DNA Content |
|---|---|
| gamete (egg or sperm) | 1c = 3000 Mb |
| regular cell before S phase | 2c = 6000 Mb |
| regular cell after S phase | 4c = 12 000 Mb |
The Number of Chromosomes (n-Value)
Human gametes contain 23 chromosomes. We can summarize this statement as 1n = 23 where n is the n‑value, the number of chromosomes in a gamete. When a 1n = 23 sperm fertilizes a 1n = 23 egg, the zygote will be 2n = 46. But, unlike DNA content (c), the number of chromosomes (n) does not change with DNA replication. A replicated chromosome is still just one chromosome. Thus, the zygote stays 2n = 46 after S phase. When the zygote divides into two cells, both contain 46 chromosomes and are still 2n = 46. Every cell in the embryo, fetus, child, and adult is also 2n = 46 (with the exceptions noted above).
In summary:
| Human Cell | Chromosome Number |
|---|---|
| gamete (egg or sperm) | 1n = 23 |
| regular cell before S phase | 2n = 46 |
| regular cell after S phase | 2n = 46 |
Note that in a normal cell, the chromosome number is 2n before and after chromosome replication. The n-value does not change while the c-value does.
Media Attributions
- Figure 3.4.1 Original by M. Deyholos/L. Canham (2017), CC BY-NC 3.0, Open Genetics Lectures
- Figure 3.4.2 Mitosis cell division by Schoolbag.info, CC BY-SA 4.0, via Wikimedia Commons
- Figure 3.4.3 Marbled lungfish 1 by OpenCage, CC BY 2.5, via Wikipedia
- Figure 3.4.4 Original by Alexander Smith (2017), CC BY-NC 3.0, Open Genetics Lectures
References
McLatchie, J. (2011, November 2). Why the “Onion Test” Fails as an Argument for “Junk DNA”. Evolution News. https://evolutionnews.org/2011/11/why_the_onion_test_fails_as_an/
Deyholos, M., & Canham, L. (2017). Figure: 4. Changes in DNA and chromosome content … [diagram]. In Locke, J., Harrington, M., Canham, L. and Min Ku Kang (Eds.), Open Genetics Lectures, Fall 2017 (Chapter 14, p. 3). Dataverse/ BCcampus. http://solr.bccampus.ca:8001/bcc/file/7a7b00f9-fb56-4c49-81a9-cfa3ad80e6d8/1/OpenGeneticsLectures_Fall2017.pdf
Smith, A. (2017). Figure 1. Human metaphase chromosome spreads [micrograph image]. In Locke, J., Harrington, M., Canham, L. and Min Ku Kang (Eds.), Open Genetics Lectures, Fall 2017 (Chapter 15, p. 1). Dataverse/ BCcampus. http://solr.bccampus.ca:8001/bcc/file/7a7b00f9-fb56-4c49-81a9-cfa3ad80e6d8/1/OpenGeneticsLectures_Fall2017.pdf
Long Descriptions
- Figure 3.4.1 A linear schematic showing simple circles to represent cells used to demonstrate the changes in DNA and chromosome content during the cell cycle and mitosis. The DNA content of cells is represented by simple black lines. The image starts with gametes containing a haploid number of two, and upon fertilization, a cell is produced which contains a diploid number (four). During the S or synthesis phase, DNA content is doubled, represented by four pairs of black lines. Finally, after meiosis, two daughter cells are produced, each containing the diploid number depicted by four black lines in each cell. [Back to Figure 3.4.1]
- Figure 3.4.2 The various stages of mitosis and the changes in chromosomes that occur are shown as follows: In the initial interphase stage, the DNA exists as diffuse chromatin, and the nuclear membrane is intact. Following this, the cell is shown to be in prophase, with condensed chromosomes and disappearing nuclear envelope. The cell then goes through the stage of metaphase, and chromosomes are shown lined up on the equator of the cell. Anaphase follows, whereby the chromatids are being pulled apart to the poles of the cell. Telophase follows, with a nuclear envelope reforming around the pulled-apart chromatids. Finally, after cytokinesis, two daughter cells are shown, each containing the diploid number of chromosomes. [Back to Figure 3.4.2]
- Figure 3.4.4 Purple-stained chromosomes, derived from three different white blood cells, are shown with each cell presenting the Metaphase stage of division. All chromosomes are shown to be replicated, with small differences in the condensation of the chromosomes, resulting in varying thicknesses of the chromosomes. [Back to Figure 3.4.4]

