8.3 Epistasis and Other Gene Interactions
Some dihybrid crosses produce a phenotypic ratio that differs from the typical 9:3:3:1. These include 9:3:4, 12:3:1, 9:7, or 15:1. Note that each of these modified ratios can be obtained by summing one or more of the 9:3:3:1 classes expected from our original dihybrid cross. In the following sections, we will look at some modified phenotypic ratios obtained from dihybrid crosses and what they might tell us about the interactions between the genes involved.
Recessive Epistasis
Epistasis (which means “standing upon”) occurs when the phenotype of one locus masks, or prevents, the phenotypic expression of another locus. Thus, following a dihybrid cross, fewer than the typical four phenotypic classes will be observed with epistasis. As we have already discussed, in the absence of epistasis, there are four phenotypic classes among the progeny of a dihybrid cross. The four phenotypic classes correspond to the genotypes: A_B_, A_bb, aaB_, and aabb. If either of the singly homozygous recessive genotypes (i.e., A_bb or aaB_) has the same phenotype as the double homozygous recessive (aabb), then a 9:3:4 phenotypic ratio will be obtained.
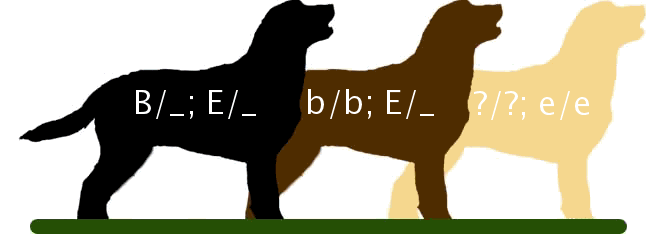
For example, in the Labrador Retriever breed of dogs (Figure 8.3.1), the B locus encodes a gene for an important step in the production of melanin. The dominant allele, B is more efficient at pigment production than the recessive b allele, thus B_ hair appears black, and bb hair appears brown. A second locus, which we will call E, controls the deposition of melanin in the hairs. At least one functional E allele is required to deposit any pigment, whether it is black or brown. Thus, all retrievers that are ee fail to deposit any melanin (and so appear pale yellow-white), regardless of the genotype at the B locus (Figure 8.3.1, right side).
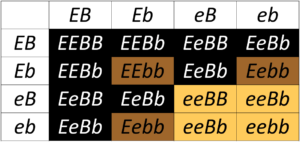
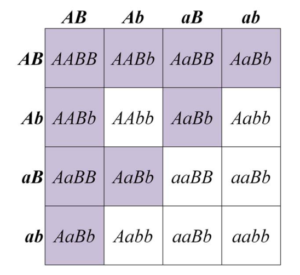
The ee genotype is therefore said to be epistatic to both the B and b alleles, since the homozygous ee phenotype masks the phenotype of the B locus. The B/b locus is said to be hypostatic to the ee genotype. Because the masking allele is, in this case, recessive. This is called recessive epistasis. A table showing all of the possible progeny genotypes and their phenotypes is shown in Figure 8.3.2.
Dominant Epistasis
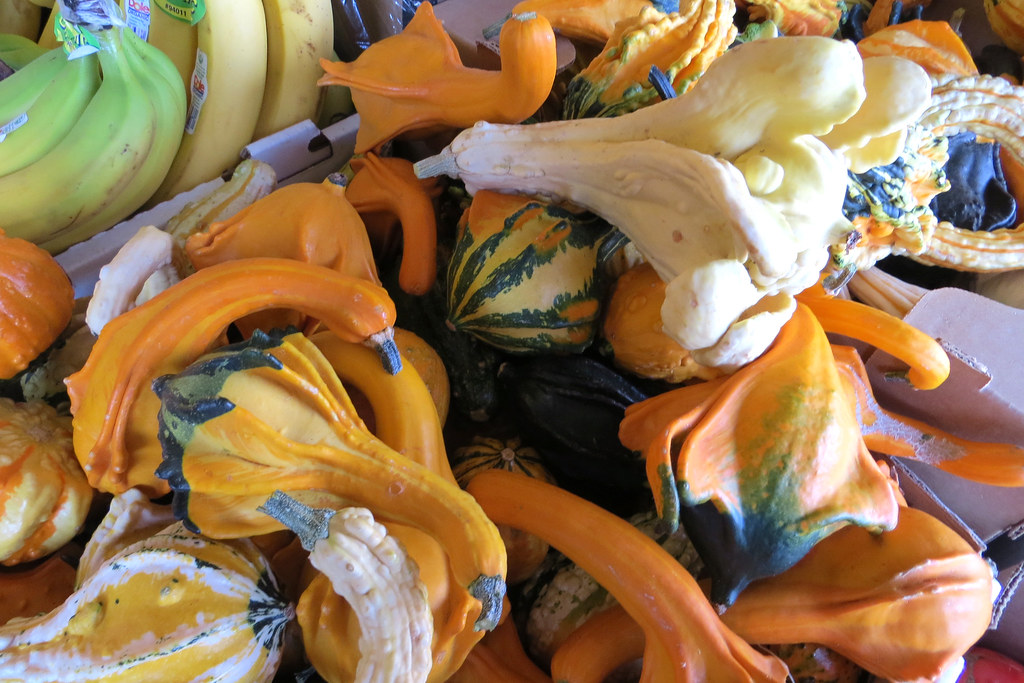
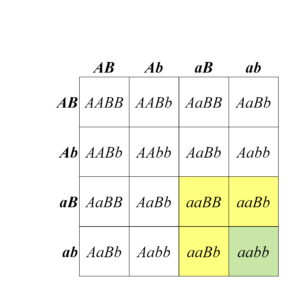
In some cases, a dominant allele at one locus may mask the phenotype of a second locus. This is called dominant epistasis. This produces a segregation ratio of 12:3:1, which can be viewed as a modification of the 9:3:3:1 ratio. Here, the A_B_ class is combined with one of the other genotypic classes (9+3) that contains a dominant allele. One of the best-known examples of a 12:3:1 segregation ratio is fruit colour in some types of squash (Figure 8.3.3). Alleles of a locus that we will call B produce either yellow (B_) or green (bb) fruit. However, in the presence of a dominant allele at a second locus that we call A, no pigment is produced at all, and fruit are white. The dominant A allele, is therefore, epistatic to both B and bb combinations (Figure 8.3.4). One possible biological interpretation of this segregation pattern, is that the function of the A allele somehow blocks an early stage of pigment synthesis, before either yellow or green pigments are produced.
Duplicate Gene Action
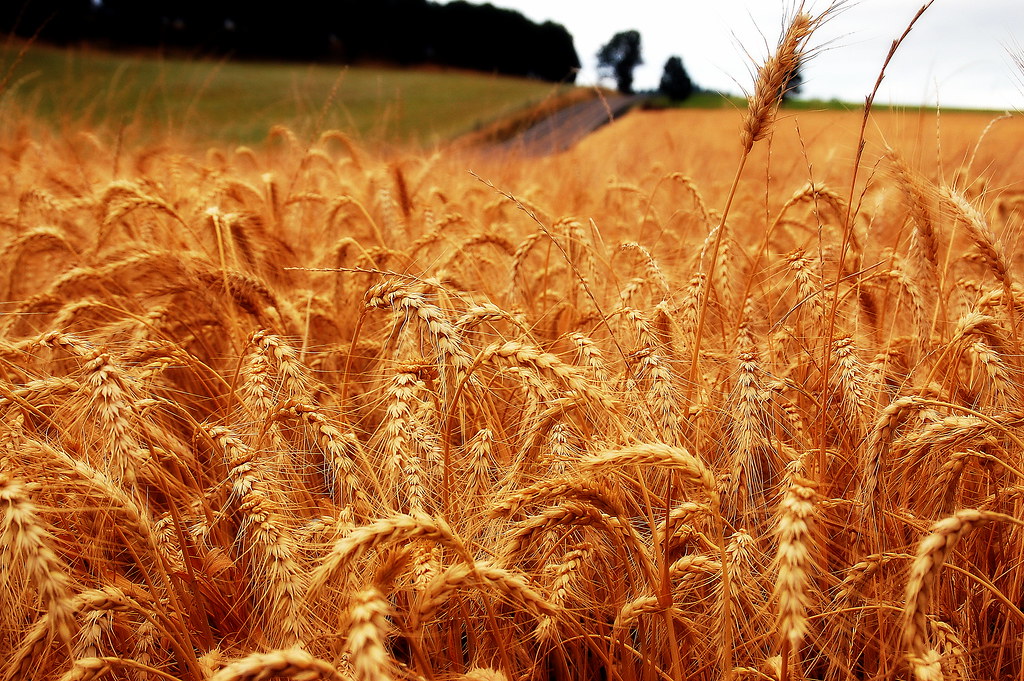
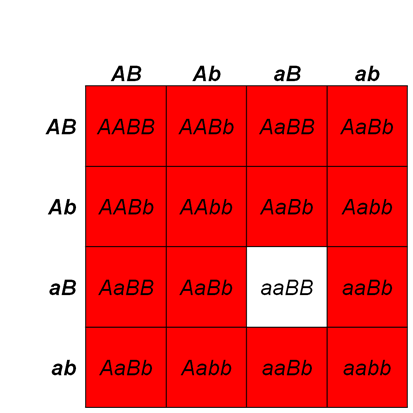
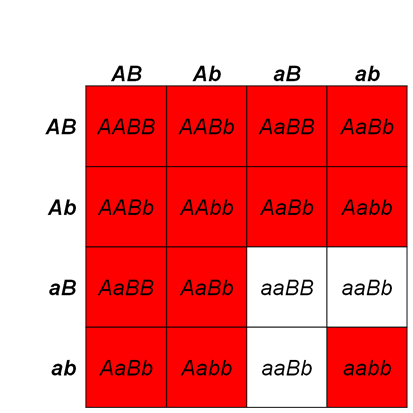
When a dihybrid cross produces progeny in two phenotypic classes in a 15:1 ratio, this can be because the two loci’s gene products have the same (redundant) functions within the same biological pathway. With yet another pigmentation pathway example, wheat shows this duplicate gene action. The biosynthesis of red pigment near the surface of wheat seeds (Figure 8.3.5) involves many genes, two of which we will label A and B. Normal, red colouration of the wheat seeds is maintained if function of either of these genes is lost in a homozygous mutant (e.g., in either aaB_ or A_bb). Only the doubly recessive mutant (aabb), which lacks function of both genes, shows a phenotype that differs from that produced by any of the other genotypes (Figure 8.3.6). A reasonable interpretation of this result is that both genes encode the same biological function, and either one alone is sufficient for the normal activity of that pathway.

Complementary Gene Action
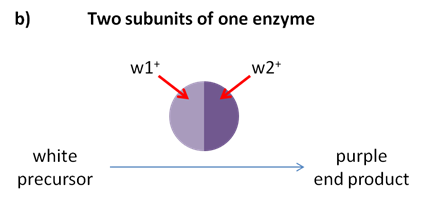
The progeny of a dihybrid cross may produce just two phenotypic classes, in an approximately 9:7 ratio. An interpretation of this ratio is that the loss of function of either A or B gene has the same phenotype as the loss of function of both genes. This is due to complementary gene action; meaning the functions of both genes work together to produce a final product. For example, consider a simple biochemical pathway in which a colourless substrate is converted by the action of gene A to another colourless product, which is then converted by the action of gene B to a visible pigment (Figure 8.3.7).
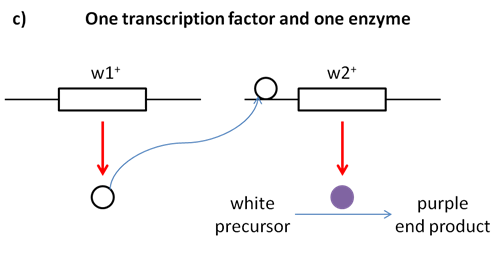
Loss of function of either A or B, or both, will have the same result — no pigment production. Thus A_bb, aaB_, and aabb will all be colourless, while only A_B_ genotypes will produce pigmented product (Figure 8.3.8). The modified 9:7 ratio may, therefore, be obtained when two genes act together in the same biochemical pathway, and when their loss of function phenotypes are indistinguishable from each other or from the loss of both genes. There are also other possible biochemical explanations for complementary gene action.
Genetic Suppression and Enhancement
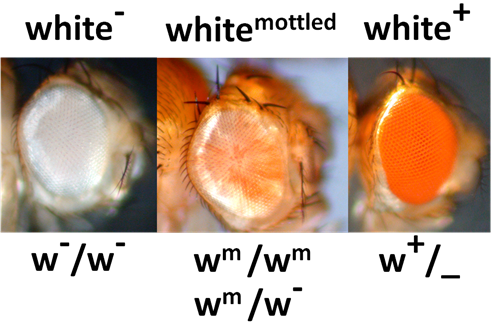
A suppressor mutation is a type of mutation that usually had no phenotype of its own, but act to suppress (makes more wildtype, less mutant) the phenotypic expression of another mutation that already exists in an organism. On the other hand, enhancer mutations have the opposite effect of suppressor mutations. They make the phenotype more mutant and less wild type (enhance the mutant phenotype).
For example, if a fly has a whitemottled (wm) phenotype, it can be suppressed to look more like white+ phenotype by a dominant Suppressor mutation (S-), or Enhanced to look more like white- by a dominant enhancer mutation (E-) (Figure 8.3.9). Note that the wm allele is recessive to white+ (w+) but dominant to white- (w-).
The suppressor mutation can be within the original gene, itself (intragenic), or outside the gene, at some other gene elsewhere in the genome (extragenic). For example, a frameshift mutation caused by a deletion in a gene can be reverted, or suppressed, by an insertion in the same gene to restore the original reading frame (intragenic suppressor mutation). A case of an extragenic suppressor mutation, on the other hand, a can occur when a mutant phenotype caused by mutation in gene A is suppressed by a mutation in gene B. In extragenic suppressor mutation, there are two types of suppressor mutations: (1) dominant suppression and (2) recessive suppression.
Dominant Suppression
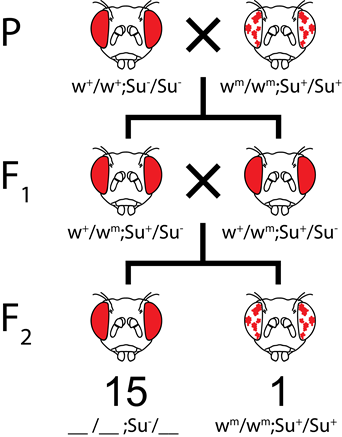
In dominant suppression, the mutant suppressor allele is dominant to the wild type suppressor allele. Therefore, one mutant suppressor allele is sufficient to suppress the mutant phenotype. For example, in Figure 8.3.10, the Su gene represents the suppressor gene. Flies that have at least one Su– allele, even though they have homozygous recessive wm/wm genotype, will show a wild-type (w+) phenotype. A fly will have wm phenotype only if it has homozygous recessive Su+/Su+ genotype. If w+/wmottled; Su+/Su- flies are crossed together, the ratio of white+ (wild type) to whitemottled (mutant) would be 15:1.
Recessive Suppression
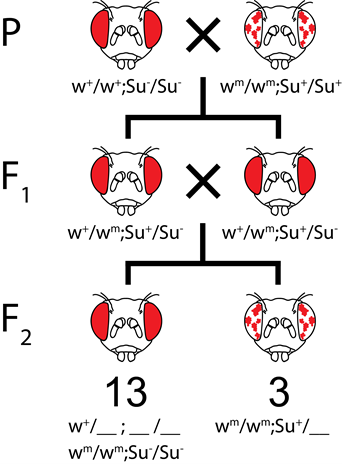
On the other hand, in recessive suppression, the mutant suppressor allele is recessive to the wild type suppressor allele. Therefore, two of the mutant alleles are needed to suppress the wm (mottled) phenotype. For example, in Figure 8.3.10, flies that have at least one w+ allele will show a wild-type phenotype. Also, flies that have su-/su- alleles will have wildtype phenotype since two mutant alleles can suppress the white gene mutation. On the other hand, flies that have the wmwm alleles will have mottled phenotype unless they have homozygous su– alleles. If w+/wmottled; Su+/Su- flies are crossed together, the ratio of white+ (wild type) to whitemottled (mutant) would be 13:3.
Summary of Modifications
| Ratio | Description | Interaction |
|---|---|---|
| 9:3:3:1 | Complete dominance at both gene pairs; new phenotypes result from interaction between dominant alleles, as well as from interaction between both homozygous recessives | None (Independent Assortment) |
| 9:4:3 | Complete dominance at both gene pairs; however, when one gene is homozygous recessive, it masks the phenotype of the other gene | Recessive epistasis |
| 9:7 | Complete dominance at both gene pairs; however, when either gene is homozygous recessive, it masks the effect of the other gene | Duplicate recessive epistasis |
| 12:3:1 | Complete dominance at both gene pairs; however, when one gene is dominant, it masks the phenotype of the other gene | Dominant epistasis |
| 15:1 | Complete dominance at both gene pairs; however, when either gene is dominant, it masks the effects of the other gene | Duplicate dominant epistasis |
| 13:3 | Complete dominance at both gene pairs; however, when either gene is dominant, it masks the effects of the other gene | Dominant and recessive epistasis |
| 9:6:1 | Complete dominance at both gene pairs; however, when either gene is dominant, it masks the effects of the other gene | Duplicate interaction |
Media Attributions
- Figure 8.3.1 LabRetColors by Elizabeth Arellano, CC BY 3.0, via Wikipedia
- Figure 8.3.2 Original by Locke (2017), CC BY-NC 3.0, Open Genetics Lectures
- Figure 8.3.3 decorative squashes by Lisa Ann Yount, CC0 1.0, via Flickr
- Figure 8.3.4 Original by Deyholos (2017), CC BY-NC 3.0, Open Genetics Lectures
- Figure 8.3.5 Wheat by Keith Ewing, CC BY-NC 2.0, via Flickr
- Figure 8.3.6 Original by Deyholos (2017), CC BY-NC 3.0, Open Genetics Lectures
- Figure 8.3.7 Original by Deyholos/Kang (2017), CC BY-NC 3.0, Open Genetics Lectures
- Figure 8.3.8 Original by Deyholos (2017), CC BY-NC 3.0, Open Genetics Lectures
- Figure 8.3.9 Original by Locke (2017), CC BY-NC 3.0, Open Genetics Lectures
- Figure 8.3.10 Original by Kang (2017), CC BY-NC 3.0, Open Genetics Lectures
- Figure 8.3.11 Original by Kang (2017), CC BY-NC 3.0, Open Genetics Lectures
References
Deyholos, M. (2017). Figures: 5, 7, 9 & 11 Genotypes and phenotypes… [digital images]. In Locke, J., Harrington, M., Canham, L. and Min Ku Kang (Eds.), Open Genetics Lectures, Fall 2017 (Chapter 26, p. 3). Dataverse/ BCcampus. http://solr.bccampus.ca:8001/bcc/file/7a7b00f9-fb56-4c49-81a9-cfa3ad80e6d8/1/OpenGeneticsLectures_Fall2017.pdf
Kang, M. K. (2017). Figures: 13. Dominant suppression; 14. Recessive suppression [digital images]. In Locke, J., Harrington, M., Canham, L. and Min Ku Kang (Eds.), Open Genetics Lectures, Fall 2017 (Chapter 26, p. 6). Dataverse/ BCcampus. http://solr.bccampus.ca:8001/bcc/file/7a7b00f9-fb56-4c49-81a9-cfa3ad80e6d8/1/OpenGeneticsLectures_Fall2017.pdf
Locke, J. (2017). Figures: 5. Genotypes and phenotypes…; and 12. Mutation in the white gene…[digital images]. In Locke, J., Harrington, M., Canham, L. and Min Ku Kang (Eds.), Open Genetics Lectures, Fall 2017 (Chapter 26, p. 3; 5). Dataverse/ BCcampus. http://solr.bccampus.ca:8001/bcc/file/7a7b00f9-fb56-4c49-81a9-cfa3ad80e6d8/1/OpenGeneticsLectures_Fall2017.pdf
Long Descriptions
- Figure 8.3.1 Three typical colours of Labrador retrievers are shown along with expected genotypes – B_E_ would be black; bbE_ would be brown and __ee would be yellow. Coat colour in this breed of dog is controlled by two genes which are epistatic in nature. [Back to Figure 8.3.1]
- Figure 8.3.2 A Punnett square shows genotypes and phenotypes among the progeny of a Dihybrid Cross of Labrador Retrievers, which are heterozygous for two loci affecting coat colour. The phenotypes of the progeny are indicated by the shading of the cells in the table: black coat (black, E_B_); chocolate coat (brown, E_bb); yellow coat (yellow, eeB_ or eebb). [Back to Figure 8.3.2]
- Figure 8.3.3 A variety of colours of squash vegetables represent the effects of dominant epistasis. Alleles of a locus that we will call “B” produce either yellow (B_) or green (bb) fruit. However, in the presence of a dominant allele at a second locus that we’ll call “A,” no pigment is produced at all, and fruit is white. [Back to Figure 8.3.3]
- Figure 8.3.4 A Punnett square shows the genotypes and phenotypes among the progeny of a dihybrid cross of squash plants heterozygous for two loci affecting fruit colour. The typical 12:3:1 ratio of dominant epistasis is demonstrated. [Back to Figure 8.3.4]
- Figure 8.3.5 Image showing a field of red wheat seeds. The biosynthesis of red pigment near the surface of wheat seeds is controlled by the actions of multiple genes. Two of these exhibit duplicate gene action, whereby the gene products have the same function within the same biological pathway. [Back to Figure 8.3.5]
- Figure 8.3.6 A Punnett square shows genotypes and phenotypes among the progeny of a dihybrid cross of wheat plants, which are heterozygous for two loci affecting seed colour. The typical 15:1 ratio of duplicate gene action is demonstrated here. [Back to Figure 8.3.6]
- Figure 8.3.7 The loss of function of one of two genes responsible for the production of a final product in a biochemical pathway results in a phenotype representative, as the loss of function of both genes is called complementary gene action. Part a) shows a simplified biochemical pathway showing complementary gene action of A and B. In this case, the same phenotypic ratios would be obtained if gene B acted before gene A in the pathway. Part b) shows the biochemical pathway of two subunits of one enzyme, and Part c) shows the biochemical pathway of one transcription factor and one enzyme. [Back to Figure 8.3.7]
- Figure 8.3.8 A Punnett square shows genotypes and phenotypes among the progeny of a dihybrid cross of a hypothetical plant heterozygous for two loci affecting flower colour. The typical 9:7 ratio of complementary gene action is demonstrated here. [Back to Figure 8.3.8]
- Figure 8.3.9 Three different possible pigments in Drosophila eyes whereby a mutation in the white gene impacts the pigmentation. White mottled is recessive to white+ and dominant to white-. This is an example of both a dominant suppressor mutation as well as an enhancer mutation. [Back to Figure 8.3.9]
- Figure 8.3.10 A Punnett square shows the results of dominant suppression and the typical 15:1 ratio obtained in the F2 generation. The Su gene shows dominant suppression of the white gene. In dominant suppression, the mutant suppressor allele is dominant to the wild type suppressor allele. Therefore, one mutant suppressor allele is sufficient to suppress the mutant phenotype. [Back to Figure 8.3.10]
- Figure 8.3.11 A Punnett square shows the results of recessive suppression and the typical 13:3 ratio obtained in the F2 generation. Here, the Su gene shows recessive suppression of the white gene. In recessive suppression, the mutant suppressor allele is recessive to the wild type suppressor allele. Therefore, two mutant alleles are needed to suppress the wm or mottled phenotype. [Back to Figure 8.3.11]

