8.4 Polygenic Inheritance
Continuous Variation
Most of the phenotypic traits commonly used in introductory genetics are qualitative. This means the phenotype exists in only two (or possibly a few more) discrete, alternative forms, such as purple or white flowers, or red or white eyes. These qualitative traits are therefore said to exhibit discrete variation. On the other hand, many interesting and important traits exhibit continuous variation, meaning they exhibit a continuous range of phenotypes that are usually measured quantitatively, such as intelligence, body mass, blood pressure in animals (including humans), and yield, water use, or vitamin content in crops. Traits with continuous variation are often complex, and do not show the simple Mendelian segregation ratios (e.g., 3:1) observed with some qualitative traits. Many complex traits are heavily influenced by the environment; nevertheless, complex traits can often have a component that is heritable, and which must therefore involve one or more genes.
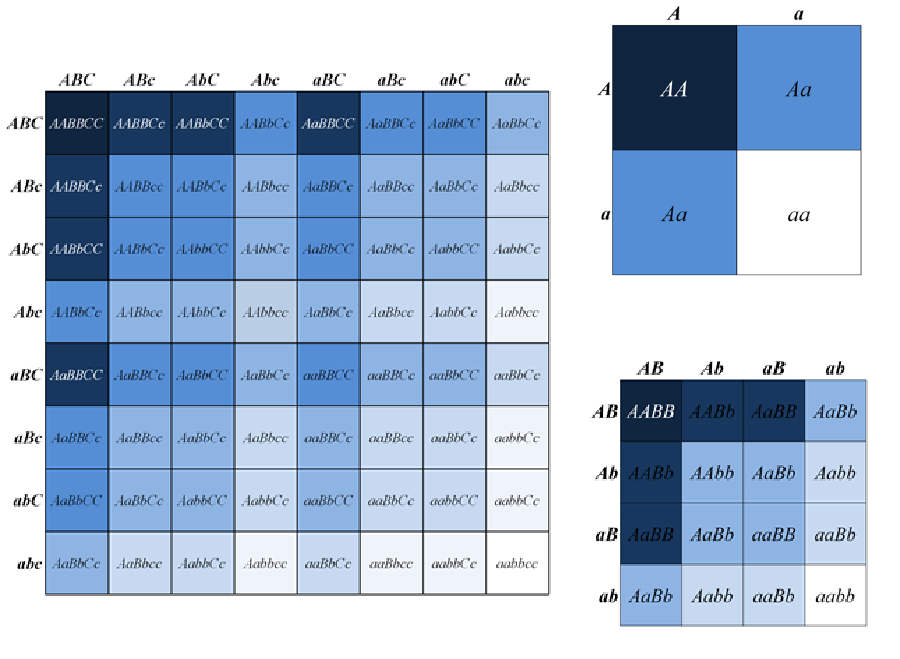
How can genes, which are inherited (in the case of a diploid) as, at most, two variants each, explain the wide range of continuous variation observed for many traits? The lack of an immediately obvious explanation to this question was one of the early objections to Mendel’s explanation of the mechanisms of heredity. However, upon further consideration, it becomes clear that the more loci that contribute to the trait, the more phenotypic classes may be observed for that trait (Figure 8.4.1).

If the number of phenotypic classes is sufficiently large (as with three or more loci), individual classes may become indistinguishable (particularly when environmental effects are included), and the phenotype appears as a continuous variation (Figure 8.4.2). Thus, quantitative traits are sometimes called polygenic traits, because it is assumed that their phenotypes are controlled by the combined activity of many genes. Note that this does not imply that each of the individual genes has an equal influence on a polygenic trait — some may have a major effect, while others only minor. Furthermore, any single gene may influence more than one trait, whether these traits are quantitative or qualitative traits.

The video, Polygenic Inheritance, by AK Lectures (2015) on YouTube, discusses the genetic basis of Polygenic Inheritance.
Media Attributions
- Figure 8.4.1 Original by Deyholos (2017), CC BY-NC 3.0, Open Genetics Lectures
- Figure 8.4.2 Original by Deyholos (2017), CC BY-NC 3.0, Open Genetics Lectures
References
AK Lectures (2015, January 12). Polygenic inheritance (video file). YouTube. https://www.youtube.com/watch?v=tKnOvPtwZL4
Deyholos, M. (2017). Figures: 15. Punnett Squares for one, two, or three loci; and 16. The more loci that affect a trait… [digital images]. In Locke, J., Harrington, M., Canham, L. and Min Ku Kang (Eds.), Open Genetics Lectures, Fall 2017 (Chapter 26, p. 8). Dataverse/ BCcampus. http://solr.bccampus.ca:8001/bcc/file/7a7b00f9-fb56-4c49-81a9-cfa3ad80e6d8/1/OpenGeneticsLectures_Fall2017.pdf
Long Descriptions
- Figure 8.4.1 Punnett Squares for One, Two, or Three Loci. This is a simplified example of up to three semi-dominant genes, and in each case the effect on the phenotype is additive, meaning the more “upper case” alleles present, the stronger the phenotype. A comparison of the Punnett squares and the associated phenotypes shows that, under these conditions, the larger the number of genes that affect a trait, the more intermediate phenotypic classes will be expected. [Back to Figure 8.4.1]
- Figure 8.4.2 Bar charts and bell curves demonstrate that the more loci that are affecting a trait, the larger the number of phenotypic classes can be expected. For some traits, the number of contributing loci is so large that the phenotypic classes blend together in apparently continuous variation. [Back to Figure 8.4.2]

