8.2 Recall – Mendelian Dihybrid Crosses
Mendel’s Second Law (A Quick Review)
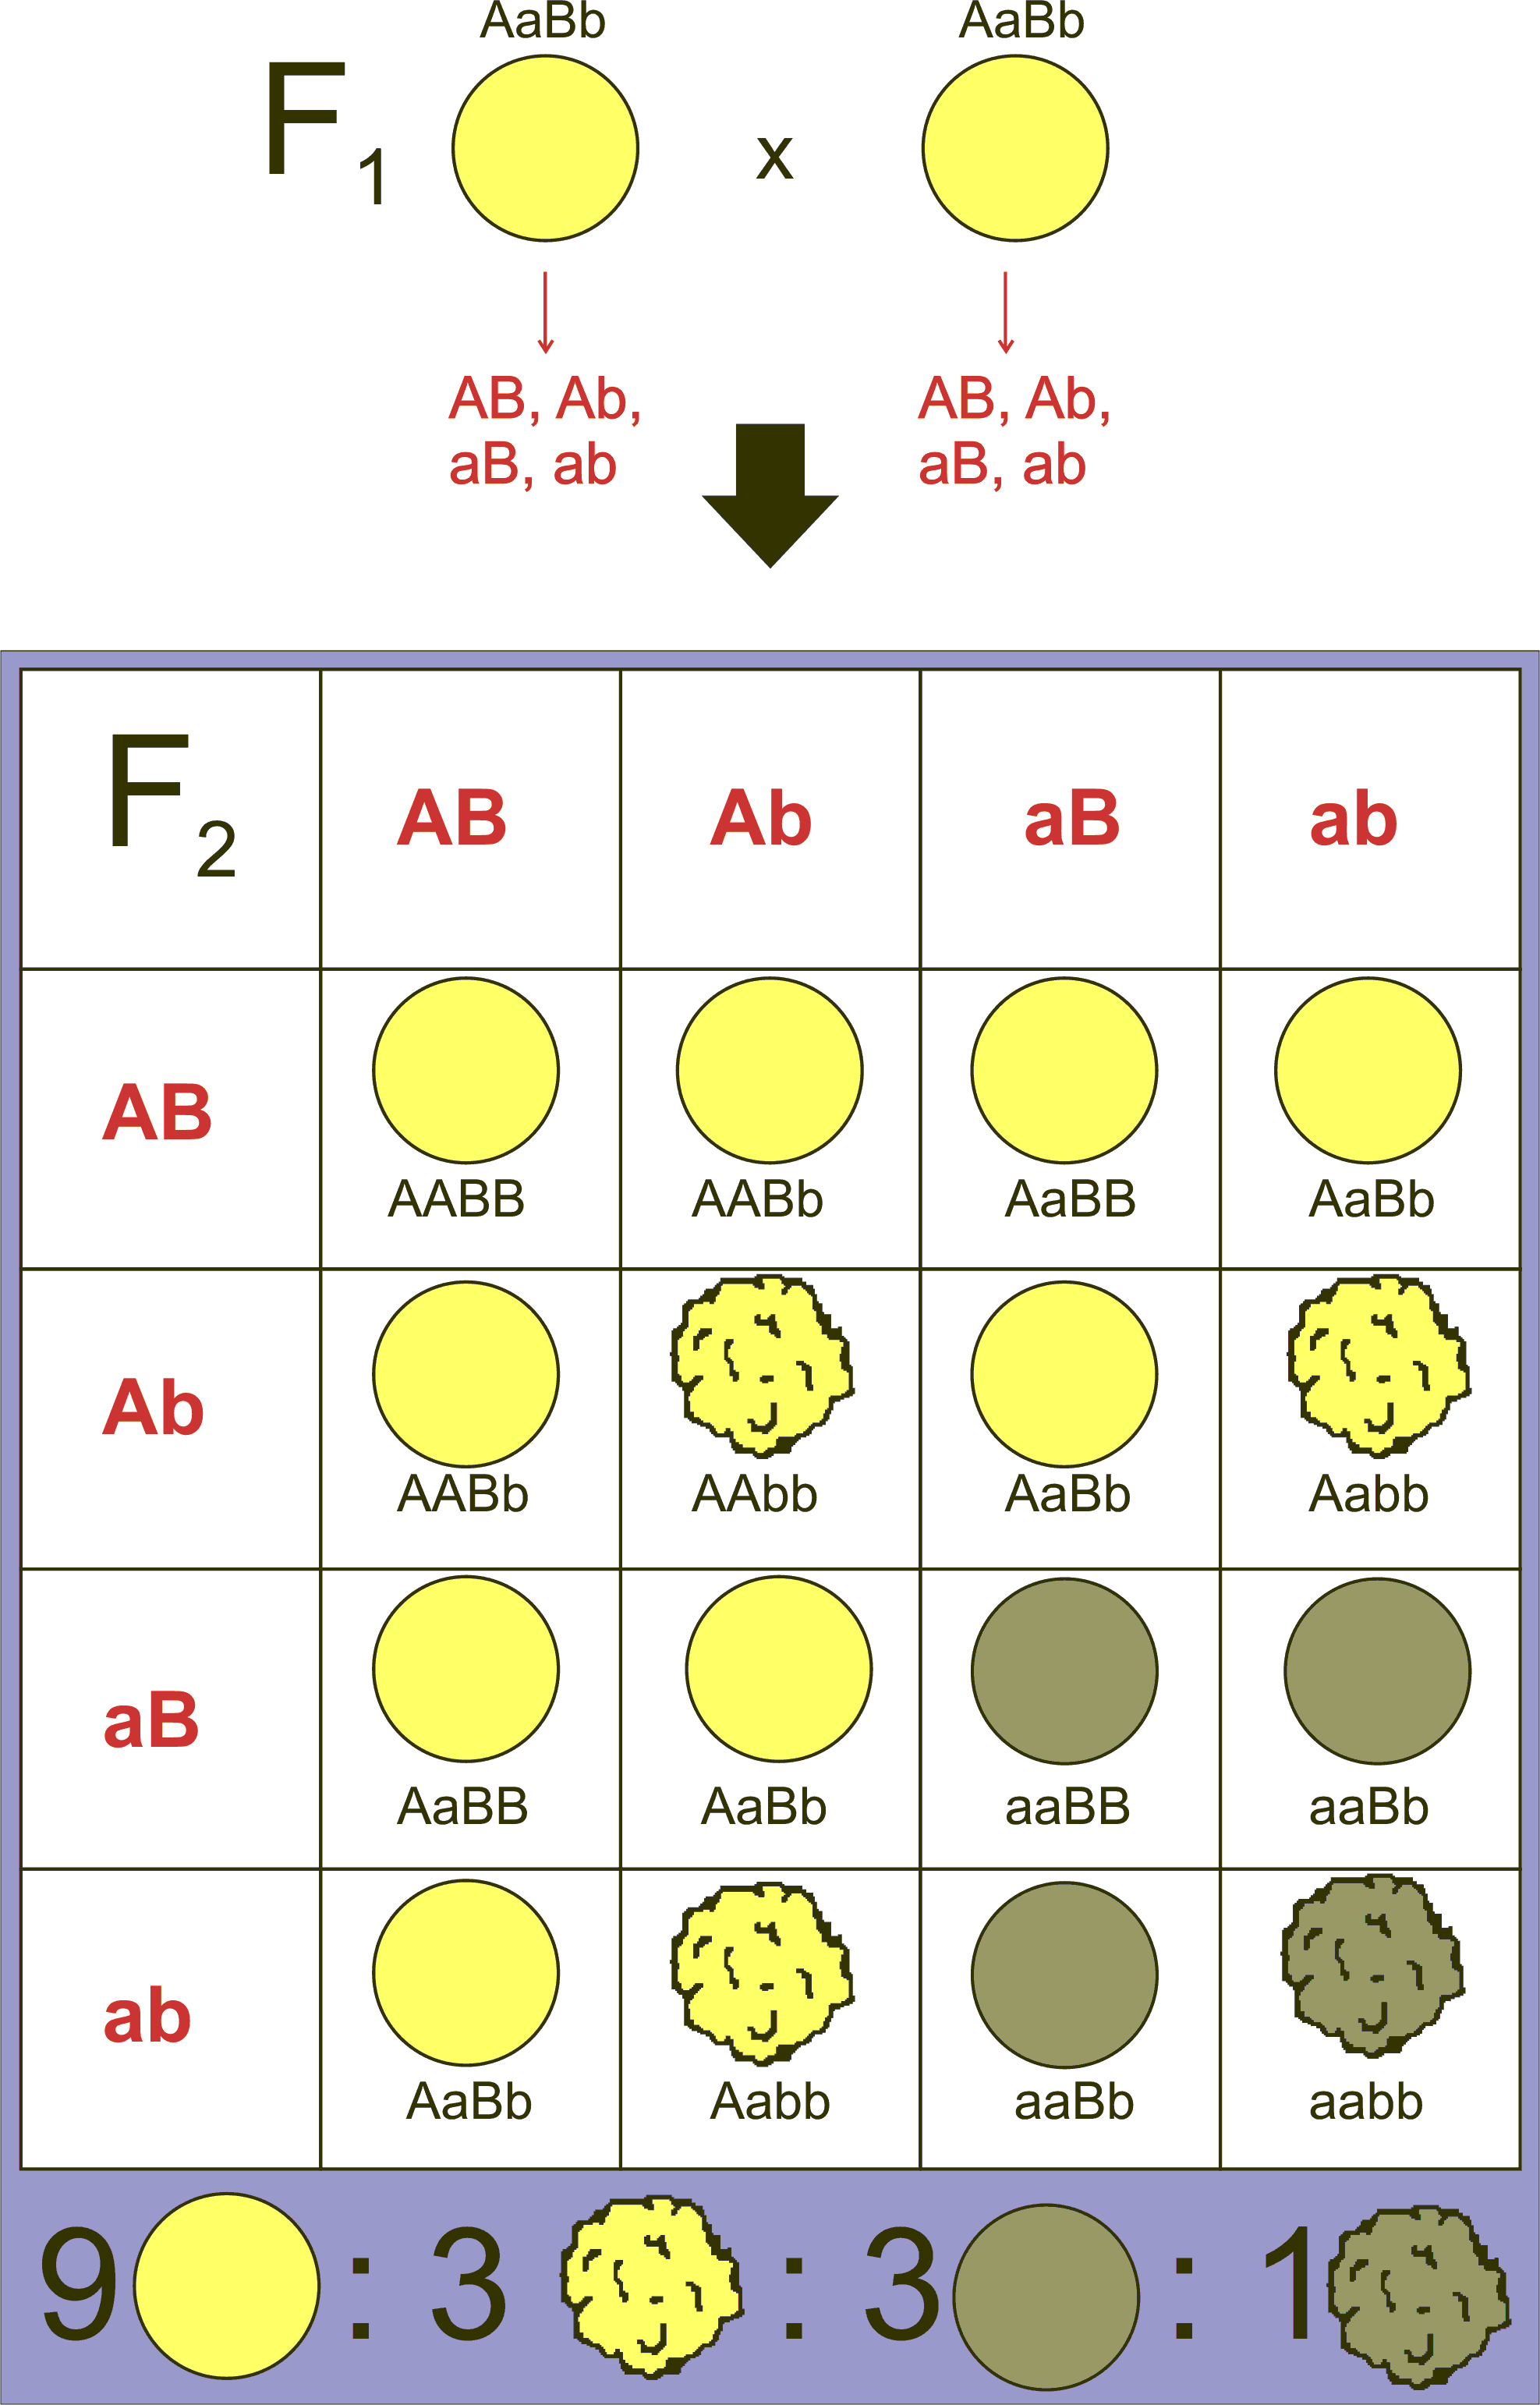
To analyze the segregation of two traits (e.g., colour, wrinkle) at the same time, in the same individual, Mendel crossed a pure breeding line of green, wrinkled peas with a pure breeding line of yellow, round peas to produce F1 progeny that were all green and round, and which were also dihybrids; they carried two alleles at each of two loci (Figure 8.2.1).
If the inheritance of seed color was truly independent of seed shape, then when the F1 dihybrids were crossed to each other, a 3:1 ratio of one trait should be observed within each phenotypic class of the other trait (Figure 8.2.1). Using the product law, we would therefore predict that if ¾ of the progeny were green, and ¾ of the progeny were round, then [latex]\frac{3}{4}\times\frac{3}{4}=\frac{9}{16}[/latex] of the progeny would be both round and green. Likewise, [latex]\frac{3}{4}\times\frac{1}{4}=\frac{3}{16}[/latex]of the progeny would be both round and yellow, and so on. By applying the product rule to all these combinations of phenotypes, we can predict a 9:3:3:1 phenotypic ratio among the progeny of a dihybrid cross, if certain conditions are met, including the independent segregation of the alleles at each locus. Indeed, 9:3:3:1 is very close to the ratio Mendel observed in his studies of dihybrid crosses, leading him to state his Second Law, the Law of Independent Assortment, which we now express as follows: two loci assort independently of each other during gamete formation.

Assumptions of the 9:3:3:1 Ratio
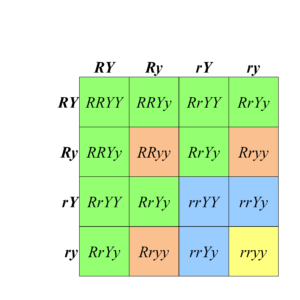
Both the product rule and the Punnett Square approaches showed that a 9:3:3:1 phenotypic ratio is expected among the progeny of a dihybrid cross, such as Mendel’s RrYy × RrYy. In making these expectations, we assumed:
- Both loci assort independently;
- One allele at each locus is completely dominant; and
- Each of four possible phenotypes can be distinguished unambiguously, with no interactions between the two genes that would alter the phenotypes.

Figure 8.2.2 A Punnett Square Showing the Results of the Dihybrid Cross. Each of the four phenotypic classes is represented by a different color of shading. [Long description]
Deviations from the 9:3:3:1 phenotypic ratio may indicate that one or more of the above conditions is not met. For example, linkage of the two loci results in a distortion of the ratios expected from independent assortment. Also, if complete dominance is lacking (e.g., co-dominance or incomplete dominance), then the ratios will also be distorted. Finally, if there is an interaction between the two loci such that the four classes cannot be distinguished (which is the topic under consideration in this chapter), the ratio will also deviate from 9:3:3:1.
Modified ratios in the progeny of a dihybrid cross can therefore reveal useful information about the genes being investigated. Such interactions lead to Modified Mendelian Ratios.
Media Attributions
- Figure 8.2.1 Mendel 3b by Miguelferig, CC0 1.0 Public Domain Dedication, via Wikimedia Commons
- Figure 8.2.2 Original by Deyholos (2017), CC BY-NC 3.0, Open Genetics Lectures
Reference
Deyholos, M. (2017). Figure 6. A Punnett square showing the results of the dihybrid cross [digital image]. In Locke, J., Harrington, M., Canham, L. and Min Ku Kang (Eds.), Open Genetics Lectures, Fall 2017 (Chapter 17, p. 4). Dataverse/ BCcampus. http://solr.bccampus.ca:8001/bcc/file/7a7b00f9-fb56-4c49-81a9-cfa3ad80e6d8/1/OpenGeneticsLectures_Fall2017.pdf
Long Descriptions
- Figure 8.2.1 A Punnett square shows the production of the F2 generation in a typical dihybrid cross, looking at the seed colour and seed shape of a particular plant. Crossing the two heterozygotes in the F1 generation produces offspring in the F2 generation in the typical 9:3:3:1 ratio. [Back to Figure 8.2.1]
- Figure 8.2.2 A Punnett square shows the results of the typical dihybrid cross, where phenotypes are produced in a 9:3:3:1 ratio. This is indicative of independent assortment of the two genes under consideration, as well as complete dominance between alleles for each trait. [Back to Figure 8.2.2]

