1.5 Punnett Squares – 3:1 Ratio
The specific ratios seen in the monohybrid cross can be described using a Punnett square, named after R.C. Punnett who devised this approach.
Given the genotypes of any two parents, we can predict all of the possible genotypes of the offspring. Furthermore, if we also know the dominance relationships for all alleles, we can predict the phenotypes of the offspring. This provides a convenient method for calculating the expected genotypic and phenotypic ratios from a cross.
A Punnett square is a matrix in which all of the possible gametes produced by one parent are listed along one axis, and the gametes from the other parent are listed along the other axis. Each possible combination of gametes is listed at the intersection of each row and column, since we know through the process of meiosis that the alleles on each chromosome separate to form the gametes.
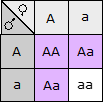
The F1 cross would be drawn as in Figure 1.5.1. As you can see, in a Monohybrid cross, the offspring ratios will be 3:1 of dominant phenotype (purple): recessive phenotype (white). Punnett squares can also be used to calculate the frequency of offspring. The frequency of each offspring is the frequency of the male gametes multiplied by the frequency of the female gamete.


View the video, Monohybrid Cross Examples – GCSE Biology (9-10), by Mr Exham Biology (2018), and watch for some worked examples on Monohybrid crosses.
Media Attributions
- Figure 1.5.1 Original by L. Canham (2017), CC BY-NC 3.0, via Online Open Genetics
- Figure 1.5.2 2924 Mendelian Pea Plant Cross, by Betts et al (2013), OpenStax College, CC BY 3.0, via Wikimedia Commons
References
Betts, J. G., Young, K. A., Wise, J. A., Johnson, E., Poe, B., Kruse, D. H., Korol, O., Johnson, J. E., Womble, M., & DeSaix, P. (2013, Apr 25). Figure 28.25 Random segregation [digital image]. Anatomy and Physiology. CNX OpenStax. https://openstax.org/books/anatomy-and-physiology/pages/28-7-patterns-of-inheritance
Canham, L. (2017). Figure 9. A Punnett square showing a monohybrid cross [diagram]. In Locke, J., Harrington, M., Canham, L. and Min Ku Kang (Eds.), Open Genetics Lectures, Fall 2017 (Chapter 16, p. 9). Dataverse/ BCcampus. http://solr.bccampus.ca:8001/bcc/file/7a7b00f9-fb56-4c49-81a9-cfa3ad80e6d8/1/OpenGeneticsLectures_Fall2017.pdf
Mr Exham Biology. (2018, Dec 31). Monohybrid cross examples – GCSE Biology (9-10) [Video file]. YouTube. https://www.youtube.com/watch?v=Xld3-Fr9oUU
Long Descriptions
- Figure 1.5.1 A simple Punnett square, represented by a square divided into nine smaller squares: The top row shows the alleles or gametes (A and a) derived from the female parent, and the left column shows the alleles or gametes derived from the male parent (A and a). The resulting offspring are shown with their accompanying genotypes of AA: Aa: aa in the ratio 1:2:1. [Back to Figure 1.5.1]
- Figure 1.5.2 Two parts: 1) A simple Punnett square consisting of four squares shows the production of offspring from the mating of a homozygous dominant parent and a homozygous recessive parent to produce 100% heterozygous progeny; 2) A Punnett square consisting of four squares shows the production of offspring from the mating of two heterozygous parents to produce the typical 3:1 monohybrid ratio of dominant to recessive phenotypes. [Back to Figure 1.5.2]

